- Page 1 and 2:
Class-8 Heavy Truck Duty Cycle Proj
- Page 3:
Vehicle Systems Program ORNL/TM-200
- Page 6 and 7:
2.7 LAUNCH OF THE FOT (OCTOBER 23,
- Page 8 and 9:
40 Connection and Support Structure
- Page 11: LIST OF TABLES Table Page 1 Pilot T
- Page 15: ACKNOWLEDGEMENTS The Oak Ridge Nati
- Page 18 and 19: Sixty channels of data were collect
- Page 20 and 21: xviii
- Page 22 and 23: The data analyses performed in Phas
- Page 24 and 25: Fig. 2. HHDDT Transient Mode In add
- Page 26 and 27: vehicle; 3) a transit bus; 4) a nei
- Page 28 and 29: payload and accessory load would al
- Page 30 and 31: Data # Performance Measure Benefit
- Page 32 and 33: Data # Performance Measure Benefit
- Page 34 and 35: Fig. 10. NGK NOx/O2 Sensors Fig. 11
- Page 36 and 37: 1.3.4 De-instrumentation: Following
- Page 38 and 39: Fig. 16. Pilot Test North-South Rou
- Page 40 and 41: GPS information collected with the
- Page 42 and 43: 2.1 REVIEW OF PERFORMANCE MEASURE R
- Page 44 and 45: 2.3.2 Performance Measures Fig. 18.
- Page 46 and 47: Signal Sensor 53 Road Grade Calcula
- Page 48 and 49: 2.3.6 Tractor and Trailer Details F
- Page 50 and 51: determined that the particular CANo
- Page 52 and 53: Cable runs to and from sensors were
- Page 54 and 55: 2.8 CONDUCTION OF FOT The FOT laste
- Page 57 and 58: 3. INTERNET DATA ACCESS TOOL The HT
- Page 59: Fig. 30. Search Results The file se
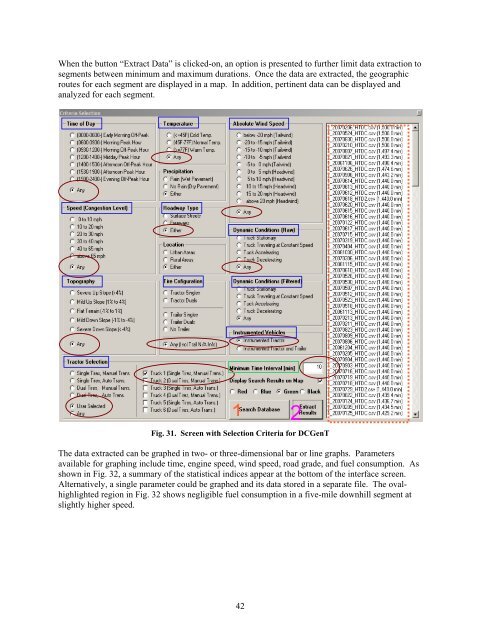
- Page 64 and 65: Data Fig. 33. Segment Merging In ad
- Page 66 and 67: Fig. 36 shows the synthetic cycle g
- Page 68 and 69: Fig. 39. A Synthetic Duty Cycle wit
- Page 70 and 71: tractors) as well as the maximum to
- Page 72 and 73: vehicle was carrying a heavy load o
- Page 74 and 75: Vehicle Speed [mph] Vehicle Speed [
- Page 76 and 77: 5.2 REAL-WORLD DUTY CYCLES Informat
- Page 78 and 79: Vehicle Speed [mph] 70 60 50 40 30
- Page 80 and 81: Given the size and complexity of th
- Page 82 and 83: data or out-of-range data. Therefor
- Page 84 and 85: 6.1.1 Spatial Information Using the
- Page 86 and 87: For those cases in which an instrum
- Page 88 and 89: Fig. 56. DCGenT Prototype Search Cr
- Page 90 and 91: at constant speed. Parameters m, b,
- Page 92 and 93: weight. Notice that, as expected, m
- Page 94 and 95: the loss of information, and conseq
- Page 96 and 97: consumption per unit of distance tr
- Page 98 and 99: q q ( − ) ( feb'− feb) 100 '
- Page 100 and 101: Table 15. General Statistics: Total
- Page 102 and 103: 70% 60% 50% 40% 30% 20% 10% 0% Idli
- Page 104 and 105: Fig. 68. All Trips with Dual Tires
- Page 106 and 107: The almost 700,000 miles logged dur
- Page 108 and 109: Frequency 300 250 200 150 100 50 0
- Page 110 and 111: Speed [mph] 80 70 60 50 40 30 20 10
- Page 112 and 113:
vehicle is hauling light or heavy l
- Page 114 and 115:
Frequency 350 300 250 200 150 100 5
- Page 116 and 117:
A summary of the statistics describ
- Page 118 and 119:
analysis controlling for the type o
- Page 120 and 121:
6.3.2.4 Summary of Fuel Efficiency
- Page 122 and 123:
Lesson Learned: A technology progre
- Page 124 and 125:
Lesson Learned: Adding external sen
- Page 126 and 127:
know if the vehicle was “filled u
- Page 129 and 130:
8. SUMMARY OF RESULTS AND CONCLUSIO
- Page 131 and 132:
9. FUTURE DIRECTIONS The Heavy Truc
- Page 133:
Appendix A PILOT TEST LETTER REPORT
- Page 136 and 137:
1.0 BACKGROUND 2.0 PROJECT OVERVIEW
- Page 138 and 139:
ACKNOWLEDGEMENTS The authors wish t
- Page 140 and 141:
evaluate the data collection system
- Page 142 and 143:
performance of their next generatio
- Page 144 and 145:
March and provided to the ORNL Prog
- Page 146 and 147:
Between January, 2005 and May, 2005
- Page 148 and 149:
Figure 4: NGK Sensor Figure 5: Omeg
- Page 150 and 151:
o Date and Time o Wind Speed o Wind
- Page 152 and 153:
Figures 28 through 31 show the ball
- Page 154 and 155:
Figure 22: Airweigh System Figure 2
- Page 156 and 157:
DVD. Figures 35 and 36 show some of
- Page 158 and 159:
3.3.7.1 Pre-Analysis Efforts: As th
- Page 160 and 161:
Task 1: Identification of Fleet(s)
- Page 162 and 163:
Data # Performance Measure Performa
- Page 164 and 165:
Sensor or eDaq Performance Performa
- Page 166 and 167:
45 46 47 48 49 50 51 52 53 Measure
- Page 168 and 169:
Data # 62 63 64 65-67 68-69 70-71 7
- Page 170 and 171:
Data # Performance Measure 87 Headi
- Page 172 and 173:
Appendix A-B Final Pilot Test Plan
- Page 174 and 175:
• DAS/sensor suite/cabling operab
- Page 176 and 177:
9 10 11 12 13 14 15 Lateral Velocit
- Page 178 and 179:
34 Rain Intensity 35 36 37 38 39 40
- Page 180 and 181:
59 60 61 62 63 64 65-67 68-69 70-71
- Page 182 and 183:
85 Longitude 86 Velocity 87 Heading
- Page 184 and 185:
3.2 Sensors The PMs listed in Table
- Page 186 and 187:
vehicles will be dedicated to the p
- Page 188 and 189:
DATE TEST ENGINEER: DRIVER: DEPARTI
- Page 190 and 191:
Jim Ridge, Dana Product Engineer, w
- Page 192 and 193:
Table 5.1 October Route and Schedul
- Page 194 and 195:
Table 5.2 December Route and Schedu
- Page 196 and 197:
Appendix A-C Field Test Signals 64
- Page 198 and 199:
9 Performance Measure Performance M
- Page 200 and 201:
Performance Measure 25 Rain Duratio
- Page 202 and 203:
Letter Report SUMMARY OF RELEVANT H
- Page 204 and 205:
Sensor or Performance Data Sensor o
- Page 206 and 207:
GAWR 44 lb AirWeigh 5800 Road Surfa
- Page 211:
Appendix B SCHRADER MEMORANDUM OF U
- Page 214 and 215:
MOU-UTB-2007001 Schrader Trucking C
- Page 216 and 217:
MOU-UTB-2007001 Schrader Trucking C
- Page 219:
Appendix C FIELD OPERATIONAL TEST P
- Page 222 and 223:
Collection, Analysis, and Archiving
- Page 224 and 225:
4.0 APPROACH Phases 2 and 3 of the
- Page 226 and 227:
Signal Sensor 60 Tractor-Trailer Ma
- Page 228 and 229:
Schrader Trucking will provide six
- Page 230 and 231:
Sensitive Information] [Partner Sen
- Page 232 and 233:
4.6 Sensor and DAS Integration to T
- Page 234 and 235:
5.5 Vehicle Deployment Methodology
- Page 236 and 237:
Start address: 2360 Cherahala Blvd
- Page 238 and 239:
Figure 6.2: Schrader Shop, Far Left
- Page 240 and 241:
Figure 6.7: eDAQ Lite with two Vehi
- Page 242 and 243:
6.5 Safety Information For Student
- Page 245:
Appendix D SYSTEM DESIGN AND OPERAT
- Page 248 and 249:
TABLE OF CONTENTS Collection, Analy
- Page 250 and 251:
9.1.2. Shutdown Procedure 9.1.3. SI
- Page 252 and 253:
Signal Sensor 26 Cruise Control Acc
- Page 254 and 255:
Figure 4.1: Air-Weigh System Compon
- Page 256 and 257:
4.5. EDAQ The eDAQ Lite is connecte
- Page 258 and 259:
the equipment inside from overheati
- Page 260 and 261:
5.4. Weather Station Connections Fi
- Page 262 and 263:
Figure 5.5.3: VBOX Cable Table 5.5.
- Page 264 and 265:
Figure 6.3: Weather Station Locatio
- Page 266 and 267:
6.6 Power Supply Use a second cable
- Page 268 and 269:
can also be changed from this windo
- Page 270 and 271:
on and the yellow light should begi
- Page 272 and 273:
Figure 7.1.3-1: Weather Station and
- Page 274 and 275:
Speed unit: m/s Sampling frequency:
- Page 276 and 277:
iii) Click on Browse to find and op
- Page 278 and 279:
c) Power Controller (Power) - no co
- Page 280 and 281:
1) Select the Transducer and Messag
- Page 282 and 283:
Figure 7.2.4-2: Adding Transducer C
- Page 284 and 285:
Figure 7.2.4-3: Editing DIO Vehicle
- Page 286 and 287:
A. Changing Units - Converting tran
- Page 288 and 289:
C. Coordinates - Assign correct sig
- Page 290 and 291:
switch) Table 7.2.5: Contents of Ti
- Page 292 and 293:
Trigger Delay Setup: Check Enable d
- Page 294 and 295:
Figure 7.2.5-6: Time Base Shifter S
- Page 296 and 297:
Units: Full Scale Estimate - Min: 0
- Page 298 and 299:
Figure 7.2.6-2: Burst History Data
- Page 300 and 301:
Press Ctrl+3 (or click Run in the T
- Page 302 and 303:
8.2. Procedures for Heavy Truck Dut
- Page 304 and 305:
d) Turn on the ignition. e) Turn on
- Page 306 and 307:
4) Change the IP address field to t
- Page 308 and 309:
5) Check to see that the computer c
- Page 310 and 311:
e) When all SIC files have been sav
- Page 312 and 313:
4) To verify the time setting, go t
- Page 314 and 315:
e) Alter the id, mask, value, etc.
- Page 316 and 317:
Longitudinal CAN 0x87FF 0x0304 Long
- Page 318 and 319:
ULSB 0x98EAFFFBC1FE00 MaxVehSpLm CA
- Page 320 and 321:
Figure 9.1.6-2: Performing a ColdSt
- Page 322 and 323:
Table 9.2.2-1: Descriptions and Uni
- Page 324 and 325:
Channel ID Sensor Format Integer? P
- Page 326 and 327:
Channel ID eDAQ Invalid Data Value
- Page 328 and 329:
Channel ID Resolution Accuracy Note
- Page 330 and 331:
9.3. Appendix C: Additional DAS Not
- Page 332 and 333:
e replicated and saved as five iden
- Page 334 and 335:
2) Type in “cmd” 3) Type “ipc
- Page 336 and 337:
Producing multiple setup files 1) G
- Page 338 and 339:
9.4. Appendix D: Checklists and For
- Page 340 and 341:
D-96
- Page 342 and 343:
9.5. Appendix E: References and Web
- Page 345 and 346:
E-3
- Page 347 and 348:
E-5
- Page 349 and 350:
E-7
- Page 351 and 352:
E-9
- Page 353 and 354:
E-11
- Page 355 and 356:
E-13
- Page 357 and 358:
E-15
- Page 359 and 360:
E-17
- Page 361 and 362:
E-19
- Page 363 and 364:
E-21
- Page 365 and 366:
E-23
- Page 367 and 368:
E-25
- Page 369 and 370:
E-27
- Page 371 and 372:
E-29
- Page 373 and 374:
E-31
- Page 375 and 376:
E-33
- Page 377 and 378:
E-35
- Page 379 and 380:
E-37
- Page 381 and 382:
E-39
- Page 383:
E-41