

Class-8 Heavy Truck Duty Cycle Project Final Report - Center for ...
Class-8 Heavy Truck Duty Cycle Project Final Report - Center for ...
Class-8 Heavy Truck Duty Cycle Project Final Report - Center for ...

Create successful ePaper yourself
Turn your PDF publications into a flip-book with our unique Google optimized e-Paper software.
vehicle is hauling light or heavy loads since most of the <strong>Class</strong>-8 truck trips fall into the second weight<br />
category.<br />
To do this, the search engine of the DCGenT Prototype was used to parse the data by truck-tire<br />
combination and vehicle load level. The vehicle weight was divided into four categories: 1) Tractor<br />
Only (trips made without any trailer), 2) Light Load (total vehicle weight between 24,000lbs and<br />
44,000lbs); 3) Medium Load (total vehicle weight between 44,000lbs and 62,000lbs); and 4) <strong>Heavy</strong><br />
Load (total vehicle weight between 62,000lbs and 80,000lbs). As in the previous sub-section, 100mile<br />
segments were considered <strong>for</strong> which the fuel efficiency was computed and counted as one<br />
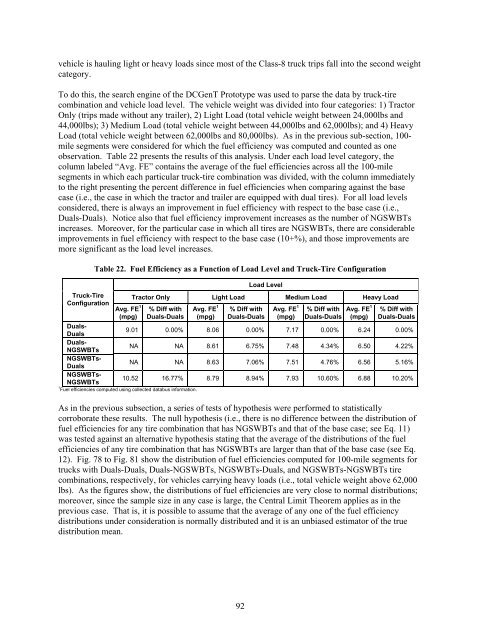
observation. Table 22 presents the results of this analysis. Under each load level category, the<br />
column labeled “Avg. FE” contains the average of the fuel efficiencies across all the 100-mile<br />
segments in which each particular truck-tire combination was divided, with the column immediately<br />
to the right presenting the percent difference in fuel efficiencies when comparing against the base<br />
case (i.e., the case in which the tractor and trailer are equipped with dual tires). For all load levels<br />
considered, there is always an improvement in fuel efficiency with respect to the base case (i.e.,<br />
Duals-Duals). Notice also that fuel efficiency improvement increases as the number of NGSWBTs<br />
increases. Moreover, <strong>for</strong> the particular case in which all tires are NGSWBTs, there are considerable<br />
improvements in fuel efficiency with respect to the base case (10+%), and those improvements are<br />
more significant as the load level increases.<br />
Table 22. Fuel Efficiency as a Function of Load Level and <strong>Truck</strong>-Tire Configuration<br />
Load Level<br />
<strong>Truck</strong>-Tire Tractor Only<br />
Configuration<br />
1<br />
Avg. FE % Diff with<br />
Light Load<br />
Avg. FE<br />
Medium Load <strong>Heavy</strong> Load<br />
(mpg) Duals-Duals<br />
1<br />
% Diff with Avg. FE<br />
(mpg) Duals-Duals<br />
1<br />
% Diff with Avg. FE<br />
(mpg) Duals-Duals<br />
1<br />
% Diff with<br />
(mpg) Duals-Duals<br />
Duals-<br />
Duals<br />
9.01 0.00% 8.06 0.00% 7.17 0.00% 6.24 0.00%<br />
Duals-<br />
NGSWBTs<br />
NA NA 8.61 6.75% 7.48 4.34% 6.50 4.22%<br />
NGSWBTs-<br />
Duals<br />
NA NA 8.63 7.06% 7.51 4.76% 6.56 5.16%<br />
NGSWBTs-<br />
10.52 16.77%<br />
NGSWBTs<br />
1<br />
Fuel efficiencies computed using collected databus in<strong>for</strong>mation.<br />
8.79 8.94% 7.93 10.60% 6.88 10.20%<br />
As in the previous subsection, a series of tests of hypothesis were per<strong>for</strong>med to statistically<br />
corroborate these results. The null hypothesis (i.e., there is no difference between the distribution of<br />
fuel efficiencies <strong>for</strong> any tire combination that has NGSWBTs and that of the base case; see Eq. 11)<br />
was tested against an alternative hypothesis stating that the average of the distributions of the fuel<br />
efficiencies of any tire combination that has NGSWBTs are larger than that of the base case (see Eq.<br />
12). Fig. 78 to Fig. 81 show the distribution of fuel efficiencies computed <strong>for</strong> 100-mile segments <strong>for</strong><br />
trucks with Duals-Duals, Duals-NGSWBTs, NGSWBTs-Duals, and NGSWBTs-NGSWBTs tire<br />
combinations, respectively, <strong>for</strong> vehicles carrying heavy loads (i.e., total vehicle weight above 62,000<br />
lbs). As the figures show, the distributions of fuel efficiencies are very close to normal distributions;<br />
moreover, since the sample size in any case is large, the Central Limit Theorem applies as in the<br />
previous case. That is, it is possible to assume that the average of any one of the fuel efficiency<br />
distributions under consideration is normally distributed and it is an unbiased estimator of the true<br />
distribution mean.<br />
92


