

Class-8 Heavy Truck Duty Cycle Project Final Report - Center for ...
Class-8 Heavy Truck Duty Cycle Project Final Report - Center for ...
Class-8 Heavy Truck Duty Cycle Project Final Report - Center for ...

Create successful ePaper yourself
Turn your PDF publications into a flip-book with our unique Google optimized e-Paper software.
the course of the year-long data collection period as any of the other five trucks. Besides this general<br />
case, particular conditions such as the effect that vehicle weight and congestion levels have on the<br />
fuel efficiency of the <strong>Class</strong>-8 trucks equipped with different type of tires are also investigated in this<br />
section.<br />
6.3.1<br />
General Statistics<br />
Over<br />
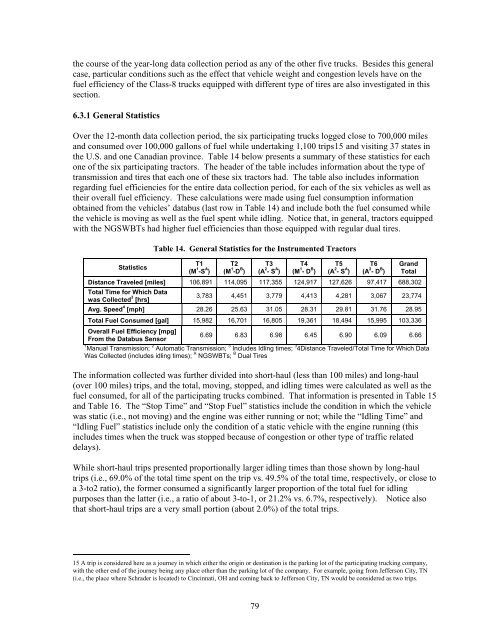
the 12-month data collection period, the six participating trucks logged close to 700,000 miles<br />
and consumed over 100,000 gallons of fuel while undertaking 1,100 trips15 and visiting 37 states in<br />
the U.S. and one Canadian province. Table 14 below presents a summary of these statistics <strong>for</strong> each<br />
one of the six participating tractors. The header of the table includes in<strong>for</strong>mation about the type of<br />
transmission and tires that each one of these six tractors had. The table also includes in<strong>for</strong>mation<br />
regarding fuel efficiencies <strong>for</strong> the entire data collection period, <strong>for</strong> each of the six vehicles as well as<br />
their overall fuel efficiency. These calculations were made using fuel consumption in<strong>for</strong>mation<br />
obtained from the vehicles’ databus (last row in Table 14) and include both the fuel consumed while<br />
the vehicle is moving as well as the fuel spent while idling. Notice that, in general, tractors equipped<br />
with the NGSWBTs had higher fuel efficiencies than those equipped with regular dual tires.<br />
Table 14. General Statistics <strong>for</strong> the Instrumented Tractors<br />
Statistics<br />
T1<br />
1 A<br />
(M -S )<br />
T2<br />
1 B<br />
(M -D )<br />
T3<br />
2 A<br />
(A - S )<br />
T4<br />
1 B<br />
(M - D )<br />
T5<br />
2 A<br />
(A - S )<br />
T6<br />
2 B<br />
(A - D )<br />
Grand<br />
Total<br />
Distance Traveled [miles] 106,891 114,095 117,355 124,917 127,626 97,417 688,302<br />
Total Time <strong>for</strong> Which Data<br />
3<br />
was Collected [hrs]<br />
3,783 4,451 3,779 4,413 4,281 3,067 23,774<br />
Avg. Speed 4 [mph] 28.26 25.63 31.05 28.31 29.81 31.76 28.95<br />
Total Fuel Consumed [gal] 15,982 16,701 16,805 19,361 18,494 15,995 103,336<br />
Overall Fuel Efficiency [mpg]<br />
From the Databus Sensor<br />
6.69 6.83 6.98 6.45 6.90 6.09 6.66<br />
1<br />
atic Tran ion; 3 Includes Idling times; 3 Manual Transmission; 4Distance Traveled/Total Time <strong>for</strong> Which Data<br />
2 Autom smiss<br />
Was Collected (includes idling times); A NGSWBTs; B Dual Tires<br />
The<br />
in<strong>for</strong>mation collected was further divided into short-haul (less than 100 miles) and long-haul<br />
(over 100 miles) trips, and the total, moving, stopped, and idling times were calculated as well as the<br />
fuel consumed, <strong>for</strong> all of the participating trucks combined. That in<strong>for</strong>mation is presented in Table 15<br />
and Table 16. The “Stop Time” and “Stop Fuel” statistics include the condition in which the vehicle<br />
was static (i.e., not moving) and the engine was either running or not; while the “Idling Time” and<br />
“Idling Fuel” statistics include only the condition of a static vehicle with the engine running (this<br />
includes times when the truck was stopped because of congestion or other type of traffic related<br />
delays).<br />
While<br />
short-haul trips presented proportionally larger idling times than those shown by long-haul<br />
trips (i.e., 69.0% of the total time spent on the trip vs. 49.5% of the total time, respectively, or close<br />
to<br />
a 3-to2 ratio), the <strong>for</strong>mer consumed a significantly larger proportion of the total fuel <strong>for</strong> idling<br />
purposes than the latter (i.e., a ratio of about 3-to-1, or 21.2% vs. 6.7%, respectively). Notice also<br />
that short-haul trips are a very small portion (about 2.0%) of the total trips.<br />
15 A trip is considered here as a journey in which either the origin or destination is the parking lot of the participating trucking company,<br />
with the other end of the journey being any place other than the parking lot of the company. For example, going from Jefferson City, TN<br />
(i.e., the place where Schrader is located) to Cincinnati, OH and coming back to Jefferson City, TN would be considered as two trips.<br />
79


