Class-8 Heavy Truck Duty Cycle Project Final Report - Center for ...
Class-8 Heavy Truck Duty Cycle Project Final Report - Center for ...
Class-8 Heavy Truck Duty Cycle Project Final Report - Center for ...
Create successful ePaper yourself
Turn your PDF publications into a flip-book with our unique Google optimized e-Paper software.
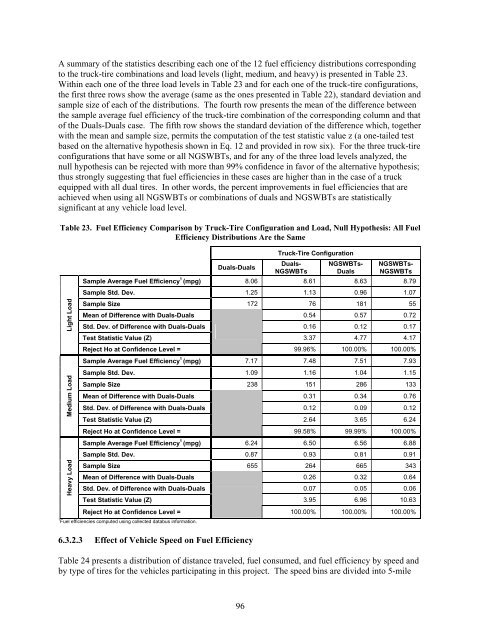
A summary of the statistics describing each one of the 12 fuel efficiency distributions corresponding<br />
to the truck-tire combinations and load levels (light, medium, and heavy) is presented in Table 23.<br />
Within each one of the three load levels in Table 23 and <strong>for</strong> each one of the truck-tire configurations,<br />
the first three rows show the average (same as the ones presented in Table 22), standard deviation and<br />
sample size of each of the distributions. The fourth row presents the mean of the difference between<br />
the sample average fuel efficiency of the truck-tire combination of the corresponding column and that<br />
of the Duals-Duals case. The fifth row shows the standard deviation of the difference which, together<br />
with the mean and sample size, permits the computation of the test statistic value z (a one-tailed test<br />
based on the alternative hypothesis shown in Eq. 12 and provided in row six). For the three truck-tire<br />
configurations that have some or all NGSWBTs, and <strong>for</strong> any of the three load levels analyzed, the<br />
null hypothesis can be rejected with more than 99% confidence in favor of the alternative hypothesis;<br />
thus strongly suggesting that fuel efficiencies in these cases are higher than in the case of a truck<br />
equipped with all dual tires. In other words, the percent improvements in fuel efficiencies that are<br />
achieved when using all NGSWBTs or combinations of duals and NGSWBTs are statistically<br />
significant at any vehicle load level.<br />
Table 23. Fuel Efficiency Comparison by <strong>Truck</strong>-Tire Configuration and Load, Null Hypothesis: All Fuel<br />
Efficiency Distributions Are the Same<br />
Light Load<br />
Medium Load<br />
<strong>Heavy</strong> Load<br />
Sample Average Fuel Efficiency 1 (mpg)<br />
Duals-Duals<br />
<strong>Truck</strong>-Tire Configuration<br />
Duals-<br />
NGSWBTs<br />
NGSWBTs-<br />
Duals<br />
NGSWBTs-<br />
NGSWBTs<br />
8.06 8.61 8.63 8.79<br />
Sample Std. Dev. 1.25 1.13 0.96 1.07<br />
Sample Size 172 76 181 55<br />
Mean of Difference with Duals-Duals 0.54 0.57 0.72<br />
Std. Dev. of Difference with Duals-Duals 0.16 0.12 0.17<br />
Test Statistic Value (Z) 3.37 4.77 4.17<br />
Reject Ho at Confidence Level =<br />
99.96% 100.00% 100.00%<br />
Sample Average Fuel Efficiency 1 (mpg) 7.17 7.48 7.51 7.93<br />
Sample Std. Dev. 1.09 1.16 1.04 1.15<br />
Sample Size 238 151 286 133<br />
Mean of Difference with Duals-Duals 0.31 0.34 0.76<br />
Std. Dev. of Difference with Duals-Duals 0.12 0.09 0.12<br />
Test Statistic Value (Z) 2.64 3.65 6.24<br />
Reject Ho at Confidence Level =<br />
99.58% 99.99% 100.00%<br />
Sample Average Fuel Efficiency 1 (mpg) 6.24 6.50 6.56 6.88<br />
Sample Std. Dev. 0.87 0.93 0.81 0.91<br />
Sample Size 655 264 665 343<br />
Mean of Difference with Duals-Duals 0.26 0.32 0.64<br />
Std. Dev. of Difference with Duals-Duals 0.07 0.05 0.06<br />
Test Statistic Value (Z) 3.95 6.96 10.63<br />
Reject Ho at Confidence Level =<br />
1<br />
Fuel efficiencies computed using collected databus in<strong>for</strong>mation.<br />
6.3.2.3 Effect of Vehicle Speed on Fuel Efficiency<br />
100.00% 100.00% 100.00%<br />
Table 24 presents a distribution of distance traveled, fuel consumed, and fuel efficiency by speed and<br />
by type of tires <strong>for</strong> the vehicles participating in this project. The speed bins are divided into 5-mile<br />
96


