

Namibia PDNA 2009 - GFDRR
Namibia PDNA 2009 - GFDRR
Namibia PDNA 2009 - GFDRR

You also want an ePaper? Increase the reach of your titles
YUMPU automatically turns print PDFs into web optimized ePapers that Google loves.
and reproductive health. This was further strengthened by<br />
dissemination of information, and creation of awareness on<br />
nutrition, malaria, diarrheal diseases, and reproductive health,<br />
gender and HIV/AIDS issues. Unfortunately these efforts have<br />
not yet translated into behavioural changes, as they tend not<br />
to take the social, economic and cultural factors that drive<br />
behaviour into consideration.<br />
Damage and Losses Assessment<br />
The assessment of the health sector was mainly qualitative in<br />
design and nature. The data collection tools were developed<br />
by the assessment team, and included (i) the Initial Rapid<br />
Assessment tool (IRA) developed by the Global Health Cluster,<br />
which was modified to collect Post-Disaster health data; (ii) the<br />
Health Resources Availability Mapping System, which collects<br />
baseline data on the health facilities; (and (iii) the DaLA tool<br />
which collects data on damages and losses incurred by the<br />
health sector during the floods.<br />
All the six affected Regions of north-central and north-eastern<br />
<strong>Namibia</strong> were visited. A total of 26 health facilities were visited<br />
including those that were flooded during the crisis. All the health<br />
facilities in the affected Regions were entered into the Health<br />
Service Availability Mapping system, mainly to register facility<br />
name, type, status, ownership and human resources, both in<br />
the facility and in the catchments population. The teams also<br />
visited communities, including seven camps and six localities/<br />
settlements, to assess the general conditions and nutrition and<br />
health conditions of the populations. Key informant interviews<br />
were the main avenues of data collection, although the team<br />
also used group discussions, participant observation, and review<br />
of records. Meetings were held with regional councils to brief<br />
them on the purpose of the assessment and also to get briefed<br />
on the crisis situation. Key informant interviews were held with<br />
Regional Directors of the Ministry of Health and Social Services<br />
(MoHSS), Chief Medical Officers (CMOs), Principal Medical<br />
Officer (PMOs) and those in charge of health facilities. In the<br />
communities, group discussions and key informant interviews<br />
were used.<br />
Damages from the flood were primarily sustained by the public<br />
sector to buildings and equipment. Three health facilities were<br />
flooded and relocated: Mabushe and Biro clinics in Kavango<br />
Region and Liskili clinic in Caprivi Region. The private sector<br />
was also affected. A private ward in Onandjokwe hospital<br />
(Oshikoto region) was closed down for 2 months and the<br />
paediatric ward was damaged when the sewerage pipes<br />
were totally damaged. In Oshana, the basement and the front<br />
entrance of the Oshakati Intermediate Hospital pharmacy was<br />
severely damaged.<br />
Losses were incurred as a result of relocation of the clinics<br />
to other sites, opening of new outreaches and expanding<br />
on the existing outreaches to serve the affected population.<br />
Prevention of impending outbreaks through disease surveillance<br />
and coordination of response and revenue losses incurred as<br />
a result of closing some wards and facilities and changing the<br />
TB treatment for some patients whose treatment had been<br />
interrupted in Omusati, Ohangwena and Oshikoto Regions.<br />
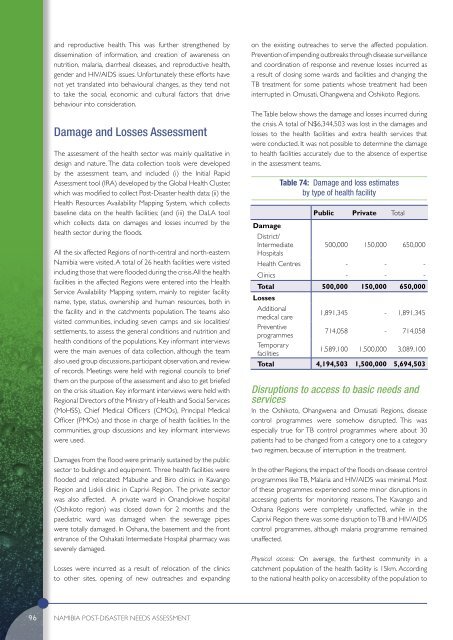
The Table below shows the damage and losses incurred during<br />
the crisis. A total of N$6,344,503 was lost in the damages and<br />
losses to the health facilities and extra health services that<br />
were conducted. It was not possible to determine the damage<br />
to health facilities accurately due to the absence of expertise<br />
in the assessment teams.<br />
Damage<br />
Table 74: Damage and loss estimates<br />
by type of health facility<br />
Public Private Total<br />
District/<br />
Intermediate 500,000 150,000 650,000<br />
Hospitals<br />
Health Centres - - -<br />
Clinics - - -<br />
Total 500,000 150,000 650,000<br />
Losses<br />
Additional<br />
medical care<br />
1,891,345 - 1,891,345<br />
Preventive<br />
programmes<br />
714,058 - 714,058<br />
Temporary<br />
facilities<br />
1,589,100 1,500,000 3,089,100<br />
Total 4,194,503 1,500,000 5,694,503<br />
Disruptions to access to basic needs and<br />
services<br />
In the Oshikoto, Ohangwena and Omusati Regions, disease<br />
control programmes were somehow disrupted. This was<br />
especially true for TB control programmes where about 30<br />
patients had to be changed from a category one to a category<br />
two regimen, because of interruption in the treatment.<br />
In the other Regions, the impact of the floods on disease control<br />
programmes like TB, Malaria and HIV/AIDS was minimal. Most<br />
of these programmes experienced some minor disruptions in<br />
accessing patients for monitoring reasons. The Kavango and<br />
Oshana Regions were completely unaffected, while in the<br />
Caprivi Region there was some disruption to TB and HIV/AIDS<br />
control programmes, although malaria programme remained<br />
unaffected.<br />
Physical access: On average, the furthest community in a<br />
catchment population of the health facility is 15km. According<br />
to the national health policy on accessibility of the population to<br />
96<br />
<strong>Namibia</strong> POST-DISASTER NEEDS ASSESSMENT


