

Namibia PDNA 2009 - GFDRR
Namibia PDNA 2009 - GFDRR
Namibia PDNA 2009 - GFDRR

Create successful ePaper yourself
Turn your PDF publications into a flip-book with our unique Google optimized e-Paper software.
of 2-6oC by end of the century, a later start and shorter rainy season in the northern regions, and possibly more intense extreme<br />
events. The combined economic effects were estimated at 1.1 to 5.8 percent of GDP. Given the latest floods and droughts, there is a<br />
need, however, to further assess future climate variability trends. This may include modelling indices such as rainfall intensity, wet day<br />
sequencing, potential evapotranspiration, changes in water availability and average river flow. It also requires modelling the expected<br />
changes in key hazards (floods, droughts and wildfires) brought about by climate change (see example of Figure 2). This modelling<br />
may be carried out by global and regional centres of expertise, such as the University of Cape Town, the SADC Drought Monitoring<br />
Centre in Botswana, and the Global Wildlife Monitoring Centre in Germany. It would be important to ensure that <strong>Namibia</strong>n experts<br />
are trained in the process.<br />
Participatory Flood Risk Mapping<br />
The final reconstruction decisions will depend largely on the level of safety deemed acceptable for the affected zones. Participatory<br />
flood mapping can be a powerful tool for consensus decision-making and community consultation of reconstruction decisions in the<br />
affected areas. The first step would be to simulate the disaster impacts of different flood return periods (e.g. once in 100 years, 1:<br />
50, 1:25). The consensus should be to move to stricter safety levels if there is a chance of future loss of lives or extreme economic<br />
hardship. The associated spatial delineation of areas “at risk” for the different return periods of flooding would then provide a basis for<br />
participatory decision making. In general, the map would indicate the location of:<br />
• Floodway: the normal river channel or high water area, prone to high velocities, high erosion and high levels of debris.<br />
Apart from critical infrastructure such as bridges, no structures should be allowed in a floodway.<br />
• Floodplain: the residual flooding area, where flood-protected structures could be allowed. However, all new<br />
development should be compatible with a flood-prone area.<br />
In some areas, a single-zone approach could be used. 16<br />
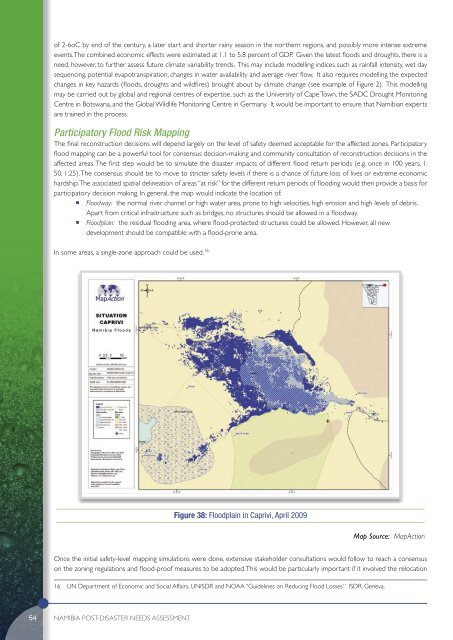
Figure 38: Floodplain in Caprivi, April <strong>2009</strong><br />
Map Source: MapAction<br />
Once the initial safety-level mapping simulations were done, extensive stakeholder consultations would follow to reach a consensus<br />
on the zoning regulations and flood-proof measures to be adopted. This would be particularly important if it involved the relocation<br />
16 UN Department of Economic and Social Affairs, UNISDR and NOAA “Guidelines on Reducing Flood Losses.” ISDR. Geneva.<br />
54<br />
<strong>Namibia</strong> POST-DISASTER NEEDS ASSESSMENT


