

Namibia PDNA 2009 - GFDRR
Namibia PDNA 2009 - GFDRR
Namibia PDNA 2009 - GFDRR

You also want an ePaper? Increase the reach of your titles
YUMPU automatically turns print PDFs into web optimized ePapers that Google loves.
4.1.2<br />
Macro-economic Impact of Floods<br />
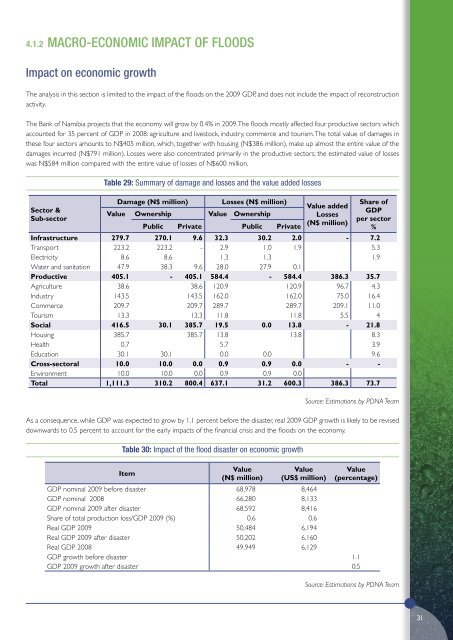
Impact on economic growth<br />
The analysis in this section is limited to the impact of the floods on the <strong>2009</strong> GDP, and does not include the impact of reconstruction<br />
activity.<br />
The Bank of <strong>Namibia</strong> projects that the economy will grow by 0.4% in <strong>2009</strong>. The floods mostly affected four productive sectors which<br />
accounted for 35 percent of GDP in 2008: agriculture and livestock, industry, commerce and tourism. The total value of damages in<br />
these four sectors amounts to N$405 million, which, together with housing (N$386 million), make up almost the entire value of the<br />
damages incurred (N$791 million). Losses were also concentrated primarily in the productive sectors; the estimated value of losses<br />
was N$584 million compared with the entire value of losses of N$600 million.<br />
Sector &<br />
Sub-sector<br />
Table 29: Summary of damage and losses and the value added losses<br />
Damage (N$ million) Losses (N$ million)<br />
Value Ownership Value Ownership<br />
Public Private Public Private<br />
Value added<br />
Losses<br />
(N$ million)<br />
Share of<br />
GDP<br />
per sector<br />
%<br />
Infrastructure 279.7 270.1 9.6 32.3 30.2 2.0 - 7.2<br />
Transport 223.2 223.2 - 2.9 1.0 1.9 5.3<br />
Electricity 8.6 8.6 1.3 1.3 1.9<br />
Water and sanitation 47.9 38.3 9.6 28.0 27.9 0.1<br />
Productive 405.1 - 405.1 584.4 - 584.4 386.3 35.7<br />
Agriculture 38.6 38.6 120.9 120.9 96.7 4.3<br />
Industry 143.5 143.5 162.0 162.0 75.0 16.4<br />
Commerce 209.7 209.7 289.7 289.7 209.1 11.0<br />
Tourism 13.3 13.3 11.8 11.8 5.5 4<br />
Social 416.5 30.1 385.7 19.5 0.0 13.8 - 21.8<br />
Housing 385.7 385.7 13.8 13.8 8.3<br />
Health 0.7 5.7 3.9<br />
Education 30.1 30.1 0.0 0.0 9.6<br />
Cross-sectoral 10.0 10.0 0.0 0.9 0.9 0.0 - -<br />
Environment 10.0 10.0 0.0 0.9 0.9 0.0<br />
Total 1,111.3 310.2 800.4 637.1 31.2 600.3 386.3 73.7<br />
Source: Estimations by <strong>PDNA</strong> Team<br />
As a consequence, while GDP was expected to grow by 1.1 percent before the disaster, real <strong>2009</strong> GDP growth is likely to be revised<br />
downwards to 0.5 percent to account for the early impacts of the financial crisis and the floods on the economy.<br />
Table 30: Impact of the flood disaster on economic growth<br />
Item<br />
Value<br />
(N$ million)<br />
Value<br />
(US$ million)<br />
Value<br />
(percentage)<br />
GDP nominal <strong>2009</strong> before disaster 68,978 8,464<br />
GDP nominal 2008 66,280 8,133<br />
GDP nominal <strong>2009</strong> after disaster 68,592 8,416<br />
Share of total production loss/GDP <strong>2009</strong> (%) 0.6 0.6<br />
Real GDP <strong>2009</strong> 50,484 6,194<br />
Real GDP <strong>2009</strong> after disaster 50,202 6,160<br />
Real GDP 2008 49,949 6,129<br />
GDP growth before disaster 1.1<br />
GDP <strong>2009</strong> growth after disaster 0.5<br />
Source: Estimations by <strong>PDNA</strong> Team<br />
31


