Namibia PDNA 2009 - GFDRR
Namibia PDNA 2009 - GFDRR
Namibia PDNA 2009 - GFDRR
Create successful ePaper yourself
Turn your PDF publications into a flip-book with our unique Google optimized e-Paper software.
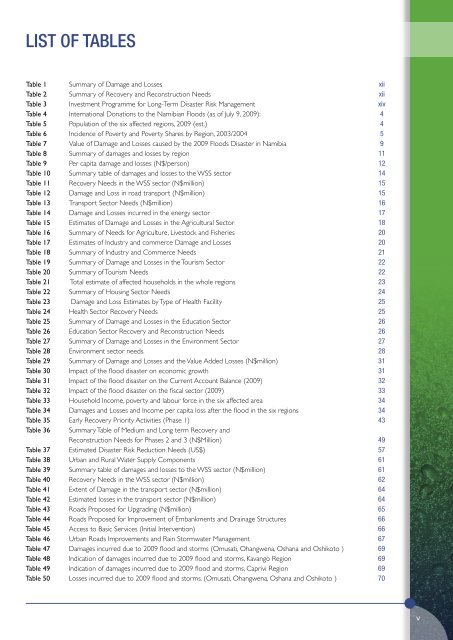
List of tables<br />
Table 1 Summary of Damage and Losses<br />
xii<br />
Table 2 Summary of Recovery and Reconstruction Needs<br />
xii<br />
Table 3 Investment Programme for Long-Term Disaster Risk Management<br />
xiv<br />
Table 4 International Donations to the <strong>Namibia</strong>n Floods (as of July 9, <strong>2009</strong>):<br />
4<br />
Table 5 Population of the six affected regions, <strong>2009</strong> (est.)<br />
4<br />
Table 6 Incidence of Poverty and Poverty Shares by Region, 2003/2004<br />
5<br />
Table 7 Value of Damage and Losses caused by the <strong>2009</strong> Floods Disaster in <strong>Namibia</strong><br />
9<br />
Table 8 Summary of damages and losses by region<br />
11<br />
Table 9 Per capita damage and losses (N$/person)<br />
12<br />
Table 10 Summary table of damages and losses to the WSS sector<br />
14<br />
Table 11 Recovery Needs in the WSS sector (N$million)<br />
15<br />
Table 12 Damage and Loss in road transport (N$million)<br />
15<br />
Table 13 Transport Sector Needs (N$million)<br />
16<br />
Table 14 Damage and Losses incurred in the energy sector<br />
17<br />
Table 15 Estimates of Damage and Losses in the Agricultural Sector<br />
18<br />
Table 16 Summary of Needs for Agriculture, Livestock and Fisheries<br />
20<br />
Table 17 Estimates of Industry and commerce Damage and Losses<br />
20<br />
Table 18 Summary of Industry and Commerce Needs<br />
21<br />
Table 19 Summary of Damage and Losses in the Tourism Sector<br />
22<br />
Table 20 Summary of Tourism Needs<br />
22<br />
Table 21 Total estimate of affected households in the whole regions<br />
23<br />
Table 22 Summary of Housing Sector Needs<br />
24<br />
Table 23 Damage and Loss Estimates by Type of Health Facility<br />
25<br />
Table 24 Health Sector Recovery Needs<br />
25<br />
Table 25 Summary of Damage and Losses in the Education Sector<br />
26<br />
Table 26 Education Sector Recovery and Reconstruction Needs<br />
26<br />
Table 27 Summary of Damage and Losses in the Environment Sector<br />
27<br />
Table 28 Environment sector needs.<br />
28<br />
Table 29 Summary of Damage and Losses and the Value Added Losses (N$million)<br />
31<br />
Table 30 Impact of the flood disaster on economic growth<br />
31<br />
Table 31 Impact of the flood disaster on the Current Account Balance (<strong>2009</strong>)<br />
32<br />
Table 32 Impact of the flood disaster on the fiscal sector (<strong>2009</strong>)<br />
33<br />
Table 33 Household Income, poverty and labour force in the six affected area<br />
34<br />
Table 34 Damages and Losses and Income per capita loss after the flood in the six regions<br />
34<br />
Table 35 Early Recovery Priority Activities (Phase 1)<br />
43<br />
Table 36 Summary Table of Medium and Long term Recovery and<br />
Reconstruction Needs for Phases 2 and 3 (N$Million) 49<br />
Table 37 Estimated Disaster Risk Reduction Needs (US$)<br />
57<br />
Table 38 Urban and Rural Water Supply Components<br />
61<br />
Table 39 Summary table of damages and losses to the WSS sector (N$million)<br />
61<br />
Table 40 Recovery Needs in the WSS sector (N$million)<br />
62<br />
Table 41 Extent of Damage in the transport sector (N$million)<br />
64<br />
Table 42 Estimated losses in the transport sector (N$million)<br />
64<br />
Table 43 Roads Proposed for Upgrading (N$million)<br />
65<br />
Table 44 Roads Proposed for Improvement of Embankments and Drainage Structures<br />
66<br />
Table 45 Access to Basic Services (Initial Intervention)<br />
66<br />
Table 46 Urban Roads Improvements and Rain Stormwater Management<br />
67<br />
Table 47 Damages incurred due to <strong>2009</strong> flood and storms (Omusati, Ohangwena, Oshana and Oshikoto ) 69<br />
Table 48 Indication of damages incurred due to <strong>2009</strong> flood and storms, Kavango Region<br />
69<br />
Table 49 Indication of damages incurred due to <strong>2009</strong> flood and storms, Caprivi Region<br />
69<br />
Table 50 Losses incurred due to <strong>2009</strong> flood and storms. (Omusati, Ohangwena, Oshana and Oshikoto )<br />
70<br />
v


