

Namibia PDNA 2009 - GFDRR
Namibia PDNA 2009 - GFDRR
Namibia PDNA 2009 - GFDRR

You also want an ePaper? Increase the reach of your titles
YUMPU automatically turns print PDFs into web optimized ePapers that Google loves.
Table 7: Value of damage and losses caused by the <strong>2009</strong> floods disaster in <strong>Namibia</strong><br />
Sector/ Sub-sector<br />
Damage<br />
(N$ million)<br />
Losses<br />
(N$ million)<br />
Damage<br />
(US$ million)<br />
Losses<br />
(US$ million)<br />
Infrastructure 279.7 32.2 34.3 4.9<br />
Water Supply & Sanitation 47.9 28 5.9 3.4<br />
Transport 223.2 2.9 27.4 0.4<br />
Energy 8.6 1.3 1.1 0.2<br />
Productive 405.1 584.4 49.7 71.7<br />
Agriculture 38.6 120.9 4.7 14.8<br />
Industry 143.5 162 17.6 19.9<br />
Commerce 209.7 289.7 25.7 35.5<br />
Tourism 13.3 11.8 1.6 1.4<br />
Social 416.5 19.5 51.1 2.4<br />
Housing 385.7 13.8 47.3 1.7<br />
Health 0.7 5.7 0.1 0.7<br />
Education 30.1 0 3.7 0.0<br />
Cross-sectoral 10 0.9 1.2 0.1<br />
Environment 10 0.9 1.2 0.1<br />
Total 1,111.30 637.1 136.4 78.2<br />
Source: Estimations by <strong>PDNA</strong> Team<br />
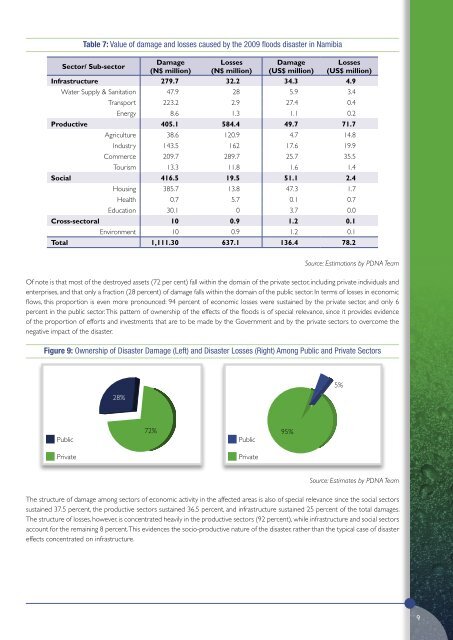
Of note is that most of the destroyed assets (72 per cent) fall within the domain of the private sector, including private individuals and<br />
enterprises, and that only a fraction (28 percent) of damage falls within the domain of the public sector. In terms of losses in economic<br />
flows, this proportion is even more pronounced: 94 percent of economic losses were sustained by the private sector, and only 6<br />
percent in the public sector. This pattern of ownership of the effects of the floods is of special relevance, since it provides evidence<br />
of the proportion of efforts and investments that are to be made by the Government and by the private sectors to overcome the<br />
negative impact of the disaster.<br />
Figure 9: Ownership of Disaster Damage (Left) and Disaster Losses (Right) Among Public and Private Sectors<br />
28%<br />
5%<br />
Public<br />
Private<br />
72% 95%<br />
Public<br />
Private<br />
Source: Estimates by <strong>PDNA</strong> Team<br />
The structure of damage among sectors of economic activity in the affected areas is also of special relevance since the social sectors<br />
sustained 37.5 percent, the productive sectors sustained 36.5 percent, and infrastructure sustained 25 percent of the total damages.<br />
The structure of losses, however, is concentrated heavily in the productive sectors (92 percent), while infrastructure and social sectors<br />
account for the remaining 8 percent. This evidences the socio-productive nature of the disaster, rather than the typical case of disaster<br />
effects concentrated on infrastructure.<br />
9


