

Namibia PDNA 2009 - GFDRR
Namibia PDNA 2009 - GFDRR
Namibia PDNA 2009 - GFDRR

Create successful ePaper yourself
Turn your PDF publications into a flip-book with our unique Google optimized e-Paper software.
soil fertility and low water retention capacity. Timing, amount<br />
and intensity of rainfall are critical determinants to output. Input<br />
use (fertilizer, improved seeds, agro-chemicals) is generally low.<br />
The MAWF reports that there are 121,141 farming households<br />
in the north central regions, supporting an average of seven to<br />
eight people per household. Most farm plots range from two to<br />
five hectares. Mahangu, or pearl millet, accounts for approximately<br />
95 percent of crops planted in the region, with sorghum making<br />
up the other five percent. In the north-east regions, maize is by<br />
far the most important crop. There are only two major irrigation<br />
schemes in the north -entral regions, the MWAF-owned Etunda<br />
Irrigation Scheme near Ruacana in Omusati and a privately-owned<br />
irrigation scheme near Tsumeb. The Etunda Irrigation Scheme<br />
totals just over 2,000 ha and produces mostly maize, followed by<br />
wheat. There are six formal irrigation schemes in the north-east<br />
regions, five of which are located in the Kavango Region. These<br />
five schemes have been developed by the Government in an<br />
effort to attract private investment in irrigation development, in<br />
accordance with its Green Scheme policy. Private sector service<br />
providers are expected to provide irrigation and marketing<br />
services to small-scale farmers that have been settled within<br />
the schemes. In addition to formal irrigation, many farmers, living<br />
in close proximity to the regions’ many waterways, practice a<br />
variety of traditional irrigation methods, including small pumps,<br />
buckets and a variety of in-situ water management practices. As<br />
subsistence farmers generally have no access to irrigation, the<br />
planting calendar in the north-central and north-east regions is<br />
dependent on the weather patterns. Crop planting in the north<br />
central and northeast regions commences with the beginning of<br />
the rainy season, generally between November and December.<br />
On average, growth in food production increased very<br />
modestly, with important variation in all the six regions. While<br />
Oshana, Kavango and Caprivi had the least annual variations<br />
in food production, the other three regions had important<br />
annual variations that deserve in-depth analysis. Overall,<br />
Omusati, Ohangwena and Oshikoto Regions had the highest<br />
contribution to the national food production with 24, 22 and<br />
21 percent respectively. Much of this growth has been achieved<br />
through area expansion, and yields have remained nearly steady<br />
over the past ten years. Except for the period of 2004–2006<br />
when yields ranged between 2.4 and 3 tons per ha, in the rest<br />
of the period they remained between 1 and 1.6 tons per ha,<br />
for an average of 1.9 tons per ha in the period. On the other<br />
hand, cultivated area has on average remained the same over<br />
the past ten years. Horticulture production, including onions,<br />
tomatoes, potatoes, cabbage, watermelons, and sweet melons,<br />
has increased since 2002 in an effort to reduce imports of<br />
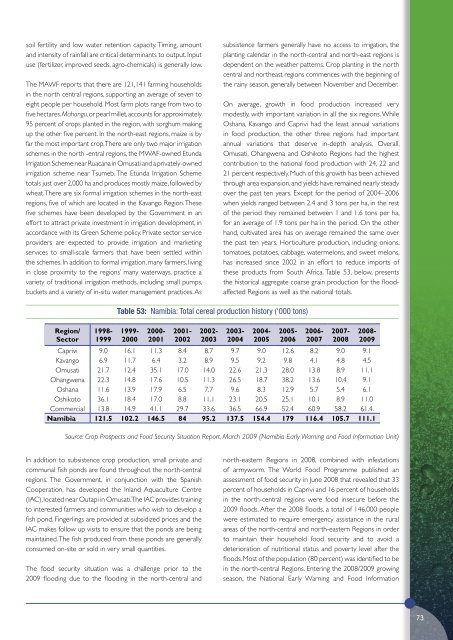
these products from South Africa. Table 53, below, presents<br />
the historical aggregate coarse grain production for the floodaffected<br />
Regions as well as the national totals.<br />
Region/<br />
Sector<br />
1998-<br />
1999<br />
Table 53: <strong>Namibia</strong>: Total cereal production history (‘000 tons)<br />
1999-<br />
2000<br />
2000-<br />
2001<br />
2001-<br />
2002<br />
2002-<br />
2003<br />
2003-<br />
2004<br />
2004-<br />
2005<br />
2005-<br />
2006<br />
2006-<br />
2007<br />
2007-<br />
2008<br />
2008-<br />
<strong>2009</strong><br />
Caprivi 9.0 16.1 11.3 8.4 8.7 9.7 9.0 12.6 8.2 9.0 9.1<br />
Kavango 6.9 11.7 6.4 3.2 8.9 9.5 9.2 9.8 4.1 4.8 4.5<br />
Omusati 21.7 12.4 35.1 17.0 14.0 22.6 21.3 28.0 13.8 8.9 11.1<br />
Ohangwena 22.3 14.8 17.6 10.5 11.3 26.5 18.7 38.2 13.6 10.4 9.1<br />
Oshana 11.6 13.9 17.9 6.5 7.7 9.6 8.3 12.9 5.7 5.4 6.1<br />
Oshikoto 36.1 18.4 17.0 8.8 11.1 23.1 20.5 25.1 10.1 8.9 11.0<br />
Commercial 13.8 14.9 41.1 29.7 33.6 36.5 66.9 52.4 60.9 58.2 61.4.<br />
<strong>Namibia</strong> 121.5 102.2 146.5 84 95.2 137.5 154.4 179 116.4 105.7 111.1<br />
Source: Crop Prospects and Food Security Situation Report, March <strong>2009</strong> (<strong>Namibia</strong> Early Warning and Food Information Unit)<br />
In addition to subsistence crop production, small private and<br />
communal fish ponds are found throughout the north-central<br />
regions. The Government, in conjunction with the Spanish<br />
Cooperation, has developed the Inland Aquaculture Centre<br />
(IAC), located near Outapi in Omusati. The IAC provides training<br />
to interested farmers and communities who wish to develop a<br />
fish pond. Fingerlings are provided at subsidized prices and the<br />
IAC makes follow up visits to ensure that the ponds are being<br />
maintained. The fish produced from these ponds are generally<br />
consumed on-site or sold in very small quantities.<br />
The food security situation was a challenge prior to the<br />
<strong>2009</strong> flooding due to the flooding in the north-central and<br />
north-eastern Regions in 2008, combined with infestations<br />
of armyworm. The World Food Programme published an<br />
assessment of food security in June 2008 that revealed that 33<br />
percent of households in Caprivi and 16 percent of households<br />
in the north-central regions were food insecure before the<br />
<strong>2009</strong> floods. After the 2008 floods, a total of 146,000 people<br />
were estimated to require emergency assistance in the rural<br />
areas of the north-central and north-eastern Regions in order<br />
to maintain their household food security and to avoid a<br />
deterioration of nutritional status and poverty level after the<br />
floods. Most of the population (80 percent) was identified to be<br />
in the north-central Regions. Entering the 2008/<strong>2009</strong> growing<br />
season, the National Early Warning and Food Information<br />
73


