

Namibia PDNA 2009 - GFDRR
Namibia PDNA 2009 - GFDRR
Namibia PDNA 2009 - GFDRR

You also want an ePaper? Increase the reach of your titles
YUMPU automatically turns print PDFs into web optimized ePapers that Google loves.
Annex 5<br />
Industry and Commerce<br />
Pre-disaster Situation<br />
The economy of <strong>Namibia</strong> is known to be strongly based on rich mining resources. The mining sectors account, in terms of GDP<br />
contribution, for an average of 17.9 percent during the period 2004–2007, with a peak of 21.7 percent in 2006, as shown in the Table<br />
below. The Government is committed to stimulating economic growth and employment. To that end, industrialization and exports<br />
are considered among the first priorities where special efforts have to be undertaken in order to sustain national economic policy.<br />
Incentives are largely concentrated on stimulating manufacturing enterprises in <strong>Namibia</strong> and promoting exports into the region and<br />
to the rest of the world. Current tax and non-tax based incentive regimes are designed to give <strong>Namibia</strong>-based entrepreneurs who<br />
invest in manufacturing and re-export trade a competitive edge. The Export Processing Zone (EPZ) is one of these newly-established<br />
incentives.<br />
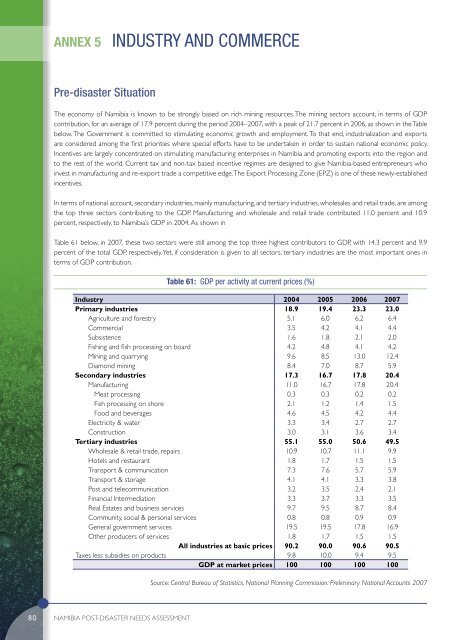
In terms of national account, secondary industries, mainly manufacturing, and tertiary industries, wholesales and retail trade, are among<br />
the top three sectors contributing to the GDP. Manufacturing and wholesale and retail trade contributed 11.0 percent and 10.9<br />
percent, respectively, to <strong>Namibia</strong>’s GDP in 2004. As shown in<br />
Table 61 below, in 2007, these two sectors were still among the top three highest contributors to GDP, with 14.3 percent and 9.9<br />
percent of the total GDP, respectively. Yet, if consideration is given to all sectors, tertiary industries are the most important ones in<br />
terms of GDP contribution.<br />
Table 61: GDP per activity at current prices (%)<br />
Industry 2004 2005 2006 2007<br />
Primary industries 18.9 19.4 23.3 23.0<br />
Agriculture and forestry 5.1 6.0 6.2 6.4<br />
Commercial 3.5 4.2 4.1 4.4<br />
Subsistence 1.6 1.8 2.1 2.0<br />
Fishing and fish processing on board 4.2 4.8 4.1 4.2<br />
Mining and quarrying 9.6 8.5 13.0 12.4<br />
Diamond mining 8.4 7.0 8.7 5.9<br />
Secondary industries 17.3 16.7 17.8 20.4<br />
Manufacturing 11.0 16.7 17.8 20.4<br />
Meat processing 0.3 0.3 0.2 0.2<br />
Fish processing on shore 2.1 1.2 1.4 1.5<br />
Food and beverages 4.6 4.5 4.2 4.4<br />
Electricity & water 3.3 3.4 2.7 2.7<br />
Construction 3.0 3.1 3.6 3.4<br />
Tertiary industries 55.1 55.0 50.6 49.5<br />
Wholesale & retail trade, repairs 10.9 10.7 11.1 9.9<br />
Hotels and restaurant 1.8 1.7 1.5 1.5<br />
Transport & communication 7.3 7.6 5.7 5.9<br />
Transport & storage 4.1 4.1 3.3 3.8<br />
Post and telecommunication 3.2 3.5 2.4 2.1<br />
Financial Intermediation 3.3 3.7 3.3 3.5<br />
Real Estates and business services 9.7 9.5 8.7 8.4<br />
Community, social & personal services 0.8 0.8 0.9 0.9<br />
General government services 19.5 19.5 17.8 16.9<br />
Other producers of services 1.8 1.7 1.5 1.5<br />
All industries at basic prices 90.2 90.0 90.6 90.5<br />
Taxes less subsidies on products 9.8 10.0 9.4 9.5<br />
GDP at market prices 100 100 100 100<br />
Source: Central Bureau of Statistics, National Planning Commission: Preliminary National Accounts 2007<br />
80<br />
<strong>Namibia</strong> POST-DISASTER NEEDS ASSESSMENT


