Workshop proceeding - final.pdf - Faculty of Information and ...
Workshop proceeding - final.pdf - Faculty of Information and ...
Workshop proceeding - final.pdf - Faculty of Information and ...

Create successful ePaper yourself
Turn your PDF publications into a flip-book with our unique Google optimized e-Paper software.
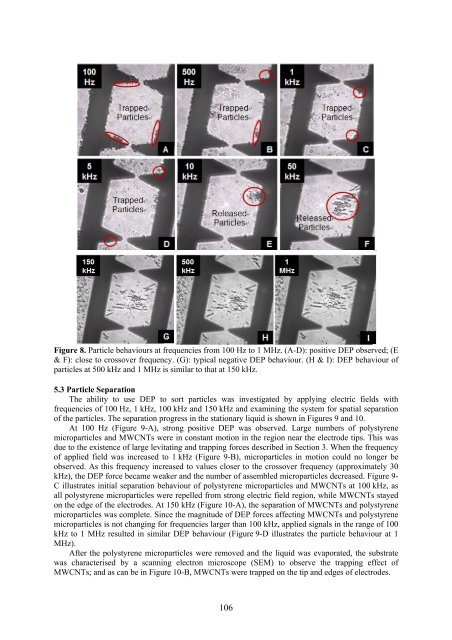
Figure 8. Particle behaviours at frequencies from 100 Hz to 1 MHz. (A-D): positive DEP observed; (E<br />
& F): close to crossover frequency. (G): typical negative DEP behaviour. (H & I): DEP behaviour <strong>of</strong><br />
particles at 500 kHz <strong>and</strong> 1 MHz is similar to that at 150 kHz.<br />
5.3 Particle Separation<br />
The ability to use DEP to sort particles was investigated by applying electric fields with<br />
frequencies <strong>of</strong> 100 Hz, 1 kHz, 100 kHz <strong>and</strong> 150 kHz <strong>and</strong> examining the system for spatial separation<br />
<strong>of</strong> the particles. The separation progress in the stationary liquid is shown in Figures 9 <strong>and</strong> 10.<br />
At 100 Hz (Figure 9-A), strong positive DEP was observed. Large numbers <strong>of</strong> polystyrene<br />
microparticles <strong>and</strong> MWCNTs were in constant motion in the region near the electrode tips. This was<br />
due to the existence <strong>of</strong> large levitating <strong>and</strong> trapping forces described in Section 3. When the frequency<br />
<strong>of</strong> applied field was increased to 1 kHz (Figure 9-B), microparticles in motion could no longer be<br />
observed. As this frequency increased to values closer to the crossover frequency (approximately 30<br />
kHz), the DEP force became weaker <strong>and</strong> the number <strong>of</strong> assembled microparticles decreased. Figure 9-<br />
C illustrates initial separation behaviour <strong>of</strong> polystyrene microparticles <strong>and</strong> MWCNTs at 100 kHz, as<br />
all polystyrene microparticles were repelled from strong electric field region, while MWCNTs stayed<br />
on the edge <strong>of</strong> the electrodes. At 150 kHz (Figure 10-A), the separation <strong>of</strong> MWCNTs <strong>and</strong> polystyrene<br />
microparticles was complete. Since the magnitude <strong>of</strong> DEP forces affecting MWCNTs <strong>and</strong> polystyrene<br />
microparticles is not changing for frequencies larger than 100 kHz, applied signals in the range <strong>of</strong> 100<br />
kHz to 1 MHz resulted in similar DEP behaviour (Figure 9-D illustrates the particle behaviour at 1<br />
MHz).<br />
After the polystyrene microparticles were removed <strong>and</strong> the liquid was evaporated, the substrate<br />
was characterised by a scanning electron microscope (SEM) to observe the trapping effect <strong>of</strong><br />
MWCNTs; <strong>and</strong> as can be in Figure 10-B, MWCNTs were trapped on the tip <strong>and</strong> edges <strong>of</strong> electrodes.<br />
106