IGCAR : Annual Report - Indira Gandhi Centre for Atomic Research
IGCAR : Annual Report - Indira Gandhi Centre for Atomic Research
IGCAR : Annual Report - Indira Gandhi Centre for Atomic Research

You also want an ePaper? Increase the reach of your titles
YUMPU automatically turns print PDFs into web optimized ePapers that Google loves.
IGC<br />
<strong>Annual</strong> <strong>Report</strong> 2007<br />
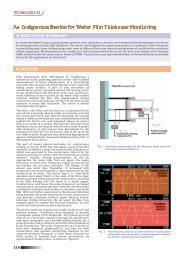
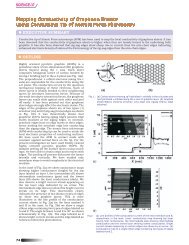
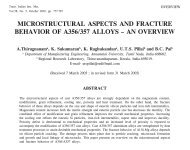
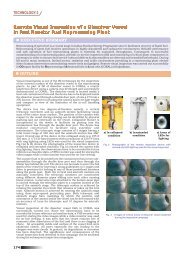
Fig.2 Crystal orientation map of<br />
phase <strong>for</strong> heat treated wire<br />
sample. Inverse pole figure<br />
contour shows primary<br />
concentration near to (1 1 -2 2)<br />
was de<strong>for</strong>med by two modes<br />
(namely wire drawing and cold<br />
rolling), followed by β solution<br />
annealing at 1273 K/1 hour<br />
and slow cooling to<br />
room temperature, resulting<br />
in α+β→β→α+β phase<br />
trans<strong>for</strong>mations. The evolution<br />
of crystallographic texture in<br />
the trans<strong>for</strong>med product has<br />
been characterized using X-ray<br />
Diffraction (XRD) and SEM-<br />
EBSD (Scanning Electron<br />
Microscopy-Electron Back<br />
Scattered Diffraction)<br />
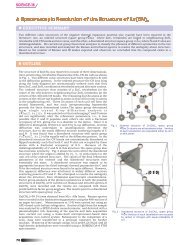
techniques. Fig. 1 shows the<br />
XRD intensity of the various (h k<br />
i l) α crystallographic planes, <strong>for</strong><br />
the wire/sheet samples be<strong>for</strong>e<br />
and after heat treatment,<br />
compared with the powder<br />
sample. An increased relative<br />
intensity of certain plane<br />
suggests preferential<br />
crystallographic alignment or<br />
'texture'. Be<strong>for</strong>e heat treatment,<br />
a 'de<strong>for</strong>mation texture' of [1 0 -<br />
1 0] α //AD (Axial direction) <strong>for</strong><br />
the wire sample, and a (0 0 0<br />
2) α /ND (Normal direction)<br />
texture <strong>for</strong> the sheet sample was<br />
observed. Heat treatment<br />
resulted in a different and more<br />
pronounced 'trans<strong>for</strong>mation<br />
texture' of [1 1 -2 2] α //AD <strong>for</strong><br />
the wire, and (1 1 -2 0) α //ND<br />
<strong>for</strong> the sheet sample. SEM-<br />
EBSD analysis was used to<br />
study microscopic detail of<br />
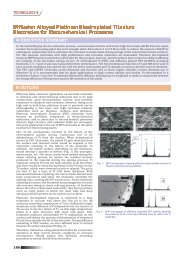
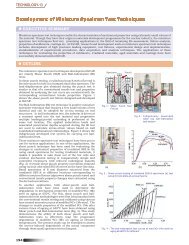
texture. Fig. 2 and 3 show the<br />
'Crystal Orientation Map' <strong>for</strong><br />
the heat treated wire, sheet<br />
samples respectively, depicting<br />
the type of crystallographic<br />
planes (color indexed) which<br />
are aligned with the sample<br />
surface. The EBSD result is in<br />
concordance with XRD. The<br />
comparison of crystallographic<br />
orientation of α lamellae and its<br />
neighboring β lamellae showed<br />
'Burgers Orientation Relation'<br />
(BOR) to be obeyed. Thus, the<br />
alloy is seen to acquire a<br />
'de<strong>for</strong>mation texture' dictated by<br />
Fig.3 Crystal orientation map<br />
of α and β lamellas <strong>for</strong> heat<br />
treated sheet sample.-grains<br />
are oriented with (1 1 -2 0)<br />
alignment.<br />
the de<strong>for</strong>mation mode. Heat<br />
treatment leads to high<br />
temperature β-texture and a<br />
distinct 'trans<strong>for</strong>mation texture'<br />
of α, as dictated by the<br />
orientation relationship during<br />
β to α trans<strong>for</strong>mation.<br />
106 FUEL CYCLE