IGCAR : Annual Report - Indira Gandhi Centre for Atomic Research
IGCAR : Annual Report - Indira Gandhi Centre for Atomic Research
IGCAR : Annual Report - Indira Gandhi Centre for Atomic Research

Create successful ePaper yourself
Turn your PDF publications into a flip-book with our unique Google optimized e-Paper software.
IGC<br />
<strong>Annual</strong> <strong>Report</strong> 2007<br />
characterization of the crystals<br />
and even today it is the first step<br />
in assessing the crystal quality.<br />
In the Laue camera, instead of<br />
the photographic X-ray film an<br />
imaging plate cut in a circular<br />
shape is loaded and covered<br />
with an opaque paper. The<br />
exposed plates are scanned to<br />
obtain the image. The Laue<br />
diffraction pattern <strong>for</strong> Si crystal<br />
in both transmitted and back<br />
reflected geometries are given<br />
in Fig.1. The inset in Fig. 1<br />
shows the enlarged view of a<br />
particular Laue spot which<br />
depends on the nature of the<br />
crystal.<br />
The powder XRD experiment<br />
was carried out using the<br />
imaging plate <strong>for</strong> a BaF 2<br />
standard sample. The sample<br />
was kept in front of the<br />
collimator in Debye Scherrer<br />
geometry and the imaging plate<br />
kept at a distance of 77.6 mm<br />
from the sample. Mo K X-ray<br />
°<br />
with a wavelength of 0.709 A is<br />
used <strong>for</strong> this experiment. The<br />
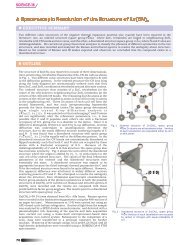
Fig.2 Powder diffraction pattern of BaF 2 sample; with some isolated<br />
diffraction spots along the Debye rings indicated using the small circles<br />
in the images. The blue circle and the arc shows the psi angle<br />
XRD image obtained is shown<br />
in figure 2. The sample was<br />
well powdered be<strong>for</strong>e carrying<br />
out the diffraction experiment.<br />
In spite of this there are a few<br />
isolated diffraction spots<br />
(shown by the circles in the<br />
image) in the powder pattern<br />
indicating the coarse grained<br />
nature of the sample. This 2D<br />
pattern is converted into a 1D<br />
pattern by azimuthal integration<br />
of pixel intensities from 0 to<br />
360° and by increasing the<br />
radius value from the centre of<br />
the concentric rings to the edge<br />
of the plate (2000 units). The<br />
center point of the rings is<br />
identified by triangulation of<br />
Fig.2 Powder diffraction pattern of BaF 2 sample; with some isolated<br />
diffraction spots along the Debye rings indicated using the small circles<br />
in the images. The blue circle and the arc shows the psi angle<br />
three points of any one of the<br />
rings. This centre is a crucial<br />
factor in the 1D data quality<br />
hence its accurate location is<br />
essential. In order to compare<br />
the integrated data with that<br />
collected using a standard<br />
powder diffractometer (with a<br />
point detector), the intensity of<br />
every 2 step is normalized by<br />
the number of pixels<br />
contributing to it. Also in the<br />
converted data there is high<br />
background hence it is<br />
removed from the image using<br />
an algorithm. The as acquired<br />
XRD image and the background<br />
subtracted image are shown in<br />
Fig. 2 and the inset (intensity<br />
plot along the circumference of<br />
the ring) shows the coarse<br />
grained nature in the sample.<br />
The converted 1D pattern<br />
be<strong>for</strong>e and after removing the<br />
background is shown in figure<br />
3. The conclusion is that if<br />
there is a single crystal<br />
diffractometer with area<br />
detector like imaging plate the<br />
same could be used <strong>for</strong> powder<br />
diffraction experiments.<br />
BASIC RESEARCH 167