IGCAR : Annual Report - Indira Gandhi Centre for Atomic Research
IGCAR : Annual Report - Indira Gandhi Centre for Atomic Research
IGCAR : Annual Report - Indira Gandhi Centre for Atomic Research

Create successful ePaper yourself
Turn your PDF publications into a flip-book with our unique Google optimized e-Paper software.
IGC<br />
<strong>Annual</strong> <strong>Report</strong> 2007<br />
Absorbance<br />
(a)<br />
ν 4<br />
712<br />
*<br />
ν 2<br />
876<br />
Raman<br />
1070<br />
1425<br />
ν 3<br />
*<br />
Reference<br />
10 mm<br />
20 mm<br />
Absorbance<br />
2ν 2 +ν 4<br />
500 1000 1500 2000 2500 3000 3500 4000<br />
Wavenumber (cm -1 )<br />
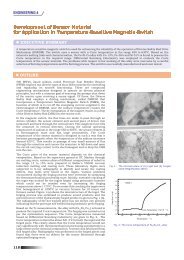
convenient method to estimate<br />
the Ca(OH) 2 content through its<br />
characteristic decomposition.<br />
The content of Ca(OH) 2 as<br />
obtained from the peak area at<br />
753 K from DTA, is plotted as a<br />
function of depth <strong>for</strong> the<br />
samples from one of the blocks<br />
in Fig.1. From the figure it is<br />
clear that the concentration is<br />
increasing linearly up to about<br />
40 mm depth of interacted<br />
concrete. Thus it is clear that<br />
DTA is a sensitive means to<br />
obtain the Ca(OH) 2 content,<br />
which in turn is an indicator of<br />
the concrete damage.<br />
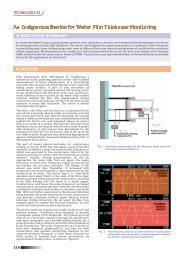
Fourier trans<strong>for</strong>m infrared<br />
(FTIR) studies<br />
Alternatively, the quality of<br />
concrete can also be<br />
determined from their<br />
characteristic stretching<br />
frequencies from the mid<br />
infrared region absorption<br />
spectrum. Control runs have<br />
also been carried out to<br />
delineate the thermal effects of<br />
sodium fire from that of the<br />
chemical interaction effects.<br />
Definite signatures of<br />
3110<br />
3240<br />
2ν 3<br />
10 mm<br />
3643<br />
20 mm<br />
Reference<br />
3000 3250 3500 3750<br />
Wavenumber (cm -1 )<br />
Fig.2a Room temperature infrared<br />
spectra of reference sample along<br />
with sodium exposed samples<br />
removed from 10 and 20 mm from<br />
the affected surface of concrete<br />
thermochemical degradation<br />
indicating dehydration and<br />
structural modification of the<br />
limestone concrete have been<br />
obtained <strong>for</strong> the first time using<br />
this technique.<br />
Fig.2a shows the room<br />
temperature mid infrared<br />
spectrum of the limestone<br />
aggregate reference concrete<br />
along with the spectra of<br />
sodium exposed samples as a<br />
function of depth. The spectrum<br />
revealed the broad absorption<br />
feature centered around 3500<br />
cm -1<br />
attributed to stretching<br />
mode of bound water in<br />
concrete. In particular the<br />
sharp feature at 3643 cm -1<br />
riding on the broad water<br />
background is said to arise due<br />
to the O-H stretching of<br />
Ca(OH) 2 - the major hydration<br />
product of Portland Cement.<br />
Estimating the area under this<br />
peak at 3643 cm -1 could follow<br />
the extent of degradation of<br />
concrete. It is clearly evident<br />
from the figure that the<br />
spectrum of the sodium<br />
exposed sample removed from<br />
10 mm from the affected<br />
surface shows appreciable<br />
changes as compared to that of<br />
the reference sample. The<br />
stretching modes of water in the<br />
affected sample reveals a<br />
significant softening associated<br />
with a dramatic increase in the<br />
intensity of the low frequency<br />
components as compared to<br />
that of the reference sample<br />
(inset in Fig. 2a). The intensity<br />
of the 3643 cm -1 peak is also<br />
seen to significantly decrease.<br />
These changes indicate the loss<br />
of both free and bound water<br />
from the concrete on account<br />
of sodium exposure, thus<br />
degrading the concrete. The<br />
appearance of a new mode at<br />
1070 cm -1 and the splitting of<br />
the doubly degenerate<br />
ν 3 and ν 4 modes indicate a<br />
structural trans<strong>for</strong>mation of the<br />
limestone aggregates.<br />
Fig.2b shows the changes in<br />
the vibrational frequencies of<br />
the stretching modes of water<br />
as a function of depth from the<br />
affected surface. It is evident<br />
from the figure that the<br />
conversion of bound water into<br />
free water is confined to depths<br />
of 30 mm from affected<br />
surface. Thus infrared<br />
spectroscopy helps to provide<br />
an insight into the changes<br />
occurring at the molecular<br />
level.<br />
Frequency (cm -1 )<br />
3260<br />
3235<br />
3210<br />
3185<br />
3450<br />
3425<br />
3400<br />
3375<br />
3615<br />
3590<br />
3565<br />
(b)<br />
A<br />
B<br />
C<br />
D<br />
Ref<br />
3540<br />
0 25 50 100<br />
Distance from surface (mm)<br />
Fig.2b Variation of stretching<br />
frequencies of water as a function of<br />
depth from the affected surface of<br />
concrete. Half shaded circles<br />
correspond to the unexposed<br />
reference samples. A, B, C and D<br />
Correspond to various location on<br />
the sodium interacted surface<br />
R&D FOR FBRs 77