IGCAR : Annual Report - Indira Gandhi Centre for Atomic Research
IGCAR : Annual Report - Indira Gandhi Centre for Atomic Research
IGCAR : Annual Report - Indira Gandhi Centre for Atomic Research

Create successful ePaper yourself
Turn your PDF publications into a flip-book with our unique Google optimized e-Paper software.
IGC<br />
<strong>Annual</strong> <strong>Report</strong> 2007<br />
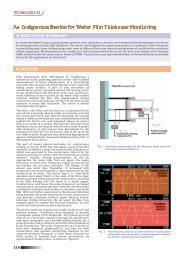
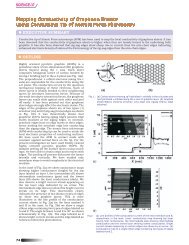
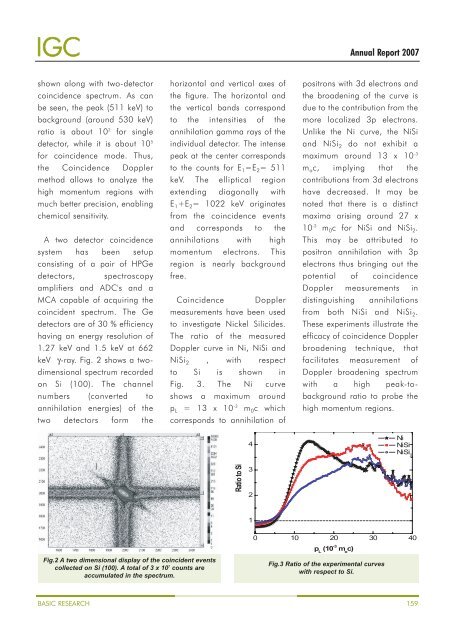
shown along with two-detector<br />
coincidence spectrum. As can<br />
be seen, the peak (511 keV) to<br />
background (around 530 keV)<br />
ratio is about 10 2 <strong>for</strong> single<br />
detector, while it is about 10 5<br />
<strong>for</strong> coincidence mode. Thus,<br />
the Coincidence Doppler<br />
method allows to analyze the<br />
high momentum regions with<br />
much better precision, enabling<br />
chemical sensitivity.<br />
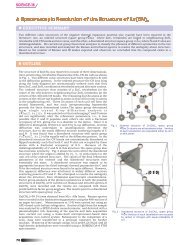
A two detector coincidence<br />
system has been setup<br />
consisting of a pair of HPGe<br />
detectors, spectroscopy<br />
amplifiers and ADC's and a<br />
MCA capable of acquiring the<br />
coincident spectrum. The Ge<br />
detectors are of 30 % efficiency<br />
having an energy resolution of<br />
1.27 keV and 1.5 keV at 662<br />
keV γ-ray. Fig. 2 shows a twodimensional<br />
spectrum recorded<br />
on Si (100). The channel<br />
numbers (converted to<br />
annihilation energies) of the<br />
two detectors <strong>for</strong>m the<br />
horizontal and vertical axes of<br />
the figure. The horizontal and<br />
the vertical bands correspond<br />
to the intensities of the<br />
annihilation gamma rays of the<br />
individual detector. The intense<br />
peak at the center corresponds<br />
to the counts <strong>for</strong> E 1 =E 2 = 511<br />
keV. The elliptical region<br />
extending diagonally with<br />
E 1 +E 2 = 1022 keV originates<br />
from the coincidence events<br />
and corresponds to the<br />
annihilations with high<br />
momentum electrons. This<br />
region is nearly background<br />
free.<br />
Coincidence Doppler<br />
measurements have been used<br />
to investigate Nickel Silicides.<br />
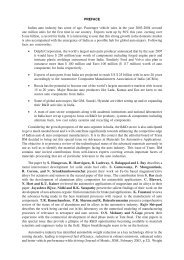
The ratio of the measured<br />
Doppler curve in Ni, NiSi and<br />
NiSi 2 , with respect<br />
to Si is shown in<br />
Fig. 3. The Ni curve<br />
shows a maximum around<br />
p L = 13 x 10 -3 m 0 c which<br />
corresponds to annihilation of<br />
4<br />
positrons with 3d electrons and<br />
the broadening of the curve is<br />
due to the contribution from the<br />
more localized 3p electrons.<br />
Unlike the Ni curve, the NiSi<br />
and NiSi 2 do not exhibit a<br />
maximum around 13 x 10 -3<br />
m o c, implying that the<br />
contributions from 3d electrons<br />
have decreased. It may be<br />
noted that there is a distinct<br />
maxima arising around 27 x<br />
10 -3 m 0 c <strong>for</strong> NiSi and NiSi 2 .<br />
This may be attributed to<br />
positron annihilation with 3p<br />
electrons thus bringing out the<br />
potential of coincidence<br />
Doppler measurements in<br />
distinguishing annihilations<br />
from both NiSi and NiSi 2 .<br />
These experiments illustrate the<br />
efficacy of coincidence Doppler<br />
broadening technique, that<br />
facilitates measurement of<br />
Doppler broadening spectrum<br />
with a high peak-tobackground<br />
ratio to probe the<br />
high momentum regions.<br />
Ni<br />
NiSi<br />
NiSi 2<br />
Ratio to Si<br />
3<br />
2<br />
1<br />
Fig.2 A two dimensional display of the coincident events<br />
collected on Si (100). A total of 3 x 10 7 counts are<br />
accumulated in the spectrum.<br />
0 10 20 30 40<br />
p L<br />
(10 -3 m o<br />
c)<br />
Fig.3 Ratio of the experimental curves<br />
with respect to Si.<br />
BASIC RESEARCH 159