IGCAR : Annual Report - Indira Gandhi Centre for Atomic Research
IGCAR : Annual Report - Indira Gandhi Centre for Atomic Research
IGCAR : Annual Report - Indira Gandhi Centre for Atomic Research

You also want an ePaper? Increase the reach of your titles
YUMPU automatically turns print PDFs into web optimized ePapers that Google loves.
IGC<br />
<strong>Annual</strong> <strong>Report</strong> 2007<br />
and having a variety of inert<br />
gas voids. The pancake probe<br />
when used in conjunction with<br />
a scanner is expected to detect,<br />
image and locate voids in fuel<br />
pins and hence, detailed<br />
experimental studies have been<br />
carried out.<br />
In order to simulate the voids<br />
in sodium column, a 0.3 mm<br />
thick aluminium tube having<br />
electrical conductivity nearly<br />
equal to sodium has been<br />
chosen and a variety of holes,<br />
notches and slots identical to<br />
the expected voids have been<br />
machined. Typical simulated<br />
notch in aluminium tube<br />
inserted in a FBTR cladding<br />
tube, and the experimental set<br />
up comprising of in-house<br />
developed z-θ scanner, EC<br />
instrument and pancake probe<br />
are shown in Fig.1.<br />
Vertical Output, mV<br />
2.0<br />
1.8<br />
1.6<br />
1.4<br />
1.2<br />
1.0<br />
0.8<br />
0.6<br />
0.4<br />
0.2<br />
0.0<br />
-0.2<br />
-0.4<br />
-0.6<br />
-0.8<br />
A<br />
Void Size (long x trans)<br />
A-2x3 mm 2<br />
B-1.5x2 mm 2<br />
C-0.8x1 mm 2<br />
B<br />
Frequency: 75 kHz<br />
Gain: 25 dB<br />
-5 -4 -3 -2 -1 0 1<br />
Horizontal Output, mV<br />
C<br />
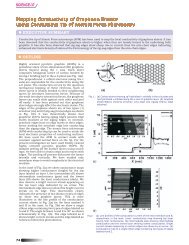
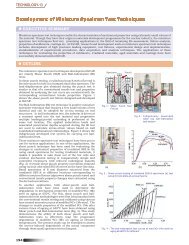
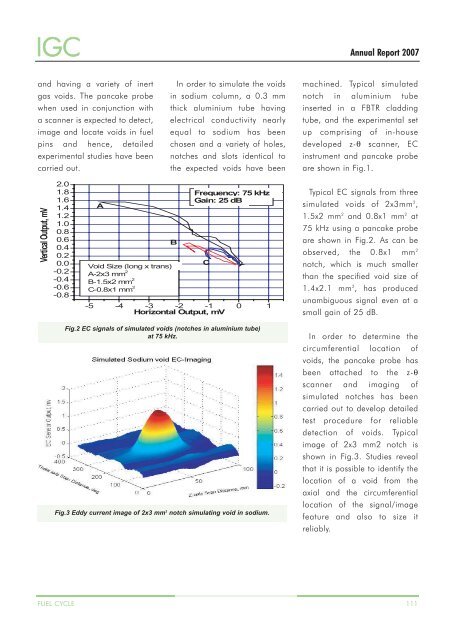
Typical EC signals from three<br />
simulated voids of 2x3mm 2 ,<br />
1.5x2 mm 2 and 0.8x1 mm 2 at<br />
75 kHz using a pancake probe<br />
are shown in Fig.2. As can be<br />
observed, the 0.8x1 mm 2<br />
notch, which is much smaller<br />
than the specified void size of<br />
1.4x2.1 mm 2 , has produced<br />
unambiguous signal even at a<br />
small gain of 25 dB.<br />
Fig.2 EC signals of simulated voids (notches in aluminium tube)<br />
at 75 kHz.<br />
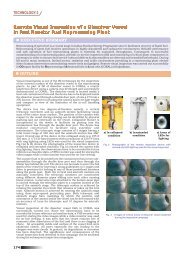
Fig.3 Eddy current image of 2x3 mm 2 notch simulating void in sodium.<br />
In order to determine the<br />
circumferential location of<br />
voids, the pancake probe has<br />
been attached to the z-θ<br />
scanner and imaging of<br />
simulated notches has been<br />
carried out to develop detailed<br />
test procedure <strong>for</strong> reliable<br />
detection of voids. Typical<br />
image of 2x3 mm2 notch is<br />
shown in Fig.3. Studies reveal<br />
that it is possible to identify the<br />
location of a void from the<br />
axial and the circumferential<br />
location of the signal/image<br />
feature and also to size it<br />
reliably.<br />
FUEL CYCLE 111