IGCAR : Annual Report - Indira Gandhi Centre for Atomic Research
IGCAR : Annual Report - Indira Gandhi Centre for Atomic Research
IGCAR : Annual Report - Indira Gandhi Centre for Atomic Research

You also want an ePaper? Increase the reach of your titles
YUMPU automatically turns print PDFs into web optimized ePapers that Google loves.
IGC<br />
<strong>Annual</strong> <strong>Report</strong> 2007<br />
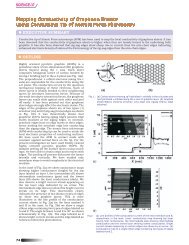
immersion transducer were<br />
used to acquire the data and<br />
obtain the C-scan images. The<br />
first backwall echoes obtained<br />
were gated to obtain the C-<br />
scan image corresponding to<br />
their amplitude. Electron back<br />
scattered diffraction (EBSD)<br />
data were collected using a<br />
TSL-OIM (orientation imaging<br />
microscopy) system on FEI<br />
Quanta 200 SEM operating at<br />
20 kV.<br />
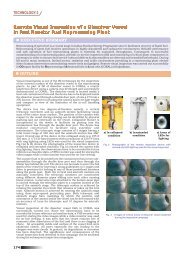
From the ultrasonic study, it<br />
has been observed that the<br />
specimens with true strains of<br />
0.2 (Fig.1a) or lower did not<br />
show any variation in the<br />
amplitude of the ultrasonic first<br />
backwall echo. The specimen<br />
with 0.3 strain, on the other<br />
hand, showed visible variation<br />
in the C-scan image. However,<br />
this variation was not<br />
systematic. The specimen<br />
<strong>for</strong>ged to 0.5 strain could<br />
clearly bring out systematic<br />
variations in the amplitude of<br />
the first backwall echo. It<br />
exhibited higher amplitude of<br />
the first backwall echoes along<br />
one of the diagonals and one<br />
of the curved sides (marked as<br />
'A' and 'B' respectively in Fig.<br />
1b).<br />
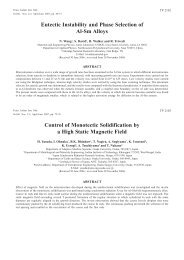
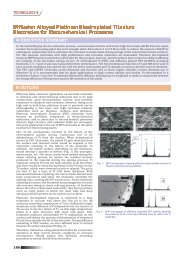
Fig.2 Image quality (IQ) maps of hot de<strong>for</strong>med specimens at<br />
0.2 strain. Boundaries with more than 5º misorientation and the twin<br />
boundaries are respectively marked as dark and white lines<br />
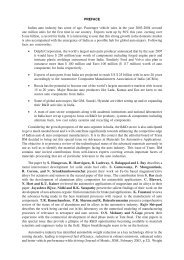
Fig.3 (a) Image quality (IQ) map of specimen <strong>for</strong>ged to 0.5 strain.<br />
Graphics conventions are same as in figure 2. (b) Enclosed section of<br />
(a) is brought out (at a higher magnification) as IPF (inverse pole figure) map,<br />
with more than 5º boundaries marked as dark lines.<br />
(c) The 'necklace' grains (fine equiaxed grains around the grain<br />
boundaries) were partitioned from (b). Grains with less than 5 m size<br />
were considered as 'necklace' grains<br />
It has been observed in our<br />
recent study that attenuation of<br />
ultrasonic waves of a particular<br />
frequency in alloy D9 is mainly<br />
governed by grain size. The<br />
specimen with larger grain size<br />
has been found to scatter more<br />
as compared to the finer one.<br />
Accordingly, larger grain size<br />
regions lead to lower amplitude<br />
of the first backwall echoes and<br />
vice versa. This observation<br />
could be employed to analyze<br />
the findings of C-scan images.<br />
Since specimen with 0.2 strain<br />
did not show any perceptible<br />
variation in the amplitude of<br />
the first backwall echo, it is<br />
likely that this specimen<br />
contains almost uni<strong>for</strong>m grain<br />
size distribution. This could be<br />
122 ENABLING TECHNOLOGIES