IGCAR : Annual Report - Indira Gandhi Centre for Atomic Research
IGCAR : Annual Report - Indira Gandhi Centre for Atomic Research
IGCAR : Annual Report - Indira Gandhi Centre for Atomic Research

Create successful ePaper yourself
Turn your PDF publications into a flip-book with our unique Google optimized e-Paper software.
IGC<br />
<strong>Annual</strong> <strong>Report</strong> 2007<br />
Case 2. Hinged support at<br />
the location where FSA rests on<br />
the sleeve top and fixed support<br />
at the discriminator location.<br />
Natural frequencies in water<br />
obtained from analytical<br />
prediction are given in Table 1<br />
. It is observed that almost<br />
similar values <strong>for</strong> natural<br />
frequencies are obtained in<br />
both SA support conditions.<br />
The SA was erected in the<br />
sleeve fixed in the Grid Box<br />
assembly, which in turn was<br />
supported on a vibration<br />
isolated test structure.<br />
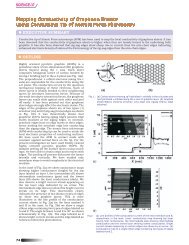
Experimental modal analysis<br />
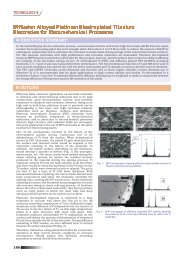
DUMMY FSA<br />
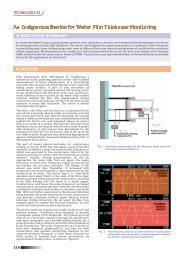
Fig.1 Experimental setup <strong>for</strong><br />
vibration measurement in water<br />
was carried out by exciting the<br />
SA laterally using a 50N <strong>for</strong>ce<br />
electro-dynamic exciter<br />
suspended from a top support<br />
structure. Fig.1 shows the<br />
experimental setup.<br />
Sine-Random signal<br />
generator is used to give input<br />
to the power amplifier through<br />
which the exciter is actuated.<br />
The response of the SA is<br />
measured using accelerometers<br />
installed at various locations<br />
along the length of the<br />
subassembly. Output of the<br />
<strong>for</strong>ce transducer and response<br />
accelerometers are recorded in<br />
FFT analyzer to estimate<br />
Frequency Response Function<br />
(FRF) up to 100 Hz. Modal<br />
frequencies above 100 Hz do<br />
not have much influence on the<br />
overall SA response due to FIV<br />
mechanisms. Hence modal<br />
measurement and analysis <strong>for</strong><br />
the present study was carried<br />
out in the frequency range upto<br />
100 Hz. The FRF at various<br />
measurement locations are<br />
transferred to modal analysis<br />
software to find out the modal<br />
parameters using polynomial<br />
curve fit method. Experiment<br />
was repeated by changing the<br />
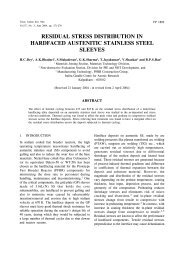
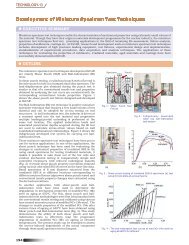
excitation point. Fig. 2 shows a<br />
typical FRF measured in water<br />
and the first three natural<br />
frequencies are 3.5, 21.3 and<br />
56.5 Hz.<br />
Hence it is confirmed that the<br />
experimental values are<br />
matching with analytical<br />
prediction. To confirm the<br />
natural frequencies obtained<br />
from the random test, SA was<br />
excited with sinusoidal<br />
excitation at 3.5 Hz. It was<br />
observed that subassembly was<br />
vibrating with more than 10<br />
mm displacement at the top<br />
end. Results from this<br />
investigation will be employed<br />
<strong>for</strong> interpreting vibration<br />
signatures obtained from FIV<br />
studies on subassemblies.<br />
100m<br />
80m<br />
Magnitude, g / N<br />
60m<br />
40m<br />
20m<br />
3.5Hz<br />
21.3 Hz<br />
50 Hz electrical<br />
56.5Hz<br />
0<br />
20 40 60 80 100<br />
Hz<br />
Fig.2 Frequency response function [Accelerometer 2730 mm from top of SA]<br />
28 R&D FOR FBRs