IGCAR : Annual Report - Indira Gandhi Centre for Atomic Research
IGCAR : Annual Report - Indira Gandhi Centre for Atomic Research
IGCAR : Annual Report - Indira Gandhi Centre for Atomic Research

You also want an ePaper? Increase the reach of your titles
YUMPU automatically turns print PDFs into web optimized ePapers that Google loves.
IGC<br />
<strong>Annual</strong> <strong>Report</strong> 2007<br />
Energy (cm -1 )<br />
2300<br />
2200<br />
600<br />
500<br />
400<br />
300<br />
200<br />
100<br />
0<br />
R<br />
Γ<br />
relaxed atomic configuration<br />
and phonon frequencies at<br />
different<br />
pressures.<br />
Calculations are per<strong>for</strong>med on<br />
8 8 8 k-point grid, with 350<br />
Rydbergs energy cutoff, using a<br />
16-node Linux cluster. Extra<br />
care is taken to ensure that<br />
inter-atomic <strong>for</strong>ces in the<br />
relaxed structure remain below<br />
10 -6 eV/Å, as otherwise phonon<br />
dispersion at ambient pressure<br />
shows imaginary frequencies.<br />
Thermal expansion coefficient<br />
is calculated from Gruneisen<br />
parameters of all modes.<br />
Phonon eigenvectors are used<br />
<strong>for</strong> assignment of phonon<br />
modes. Soft phonon modes<br />
contributing to NTE are<br />
identified from the high<br />
pressure experiments and<br />
simulations. Zn(CN) 2 procured<br />
X<br />
M<br />
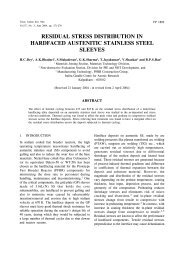
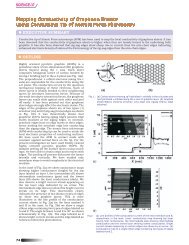
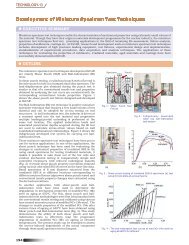
Fig.2 Calculated phonon dispersion curve <strong>for</strong> Zn(CN) 2<br />
at ambient pressure<br />
Γ<br />
from Alfa-Aesar (purity ><br />
99.5%), is loaded into a Mao-<br />
Bell type diamond anvil cell<br />
with methanol-ethanol (4:1)<br />
mixture as pressure transmitting<br />
medium. Ruby fluorescence is<br />
used to measure pressure.<br />
Raman spectra are recorded at<br />
different pressures in the<br />
backscattering geometry using<br />
the 488-nm line of an argon<br />
ion laser, using a double<br />
monochromator, and detected<br />
with a cooled photomultiplier<br />
tube operated in the photon<br />
counting mode. The spectral<br />
range covered is 10-2400 cm -1<br />
that also includes the<br />
C≡N stretch mode around<br />
2220 cm -1 .<br />
Figure1 depicts the phonon<br />
frequency (ω) vs. pressure (P)<br />
<strong>for</strong> the three modes observed<br />
by Raman spectroscopy. Inset<br />
shows the behaviour of the<br />
calculated mode frequencies.<br />
Fig.2 shows the phonon<br />
dispersion obtained <strong>for</strong><br />
Zn(CN) 2 from simulation at<br />
ambient pressure. Each of the<br />
mode frequencies in Fig.1 inset<br />
correspond to those at the Γ<br />
point in the phonon dispersion.<br />
It has been suggested that<br />
ZnC 4 /N 4 rigid units are<br />
responsible <strong>for</strong> NTE. But our<br />
results show that only the C≡N<br />
bond can be treated as rigid<br />
unit and the soft<br />
modes correspond to the<br />
librational and translational<br />
modes of C≡N bond,<br />
with librational modes<br />
contributing more to thermal<br />
expansion. Out of the eleven<br />
zone-centre optical modes, six<br />
modes exhibit negative<br />
Gruneisen parameter. The<br />
value of thermal expansion<br />
coefficient, , calculated from<br />
the Gruneisen parameters is in<br />
excellent agreement with<br />
experimental value. A rapid<br />
disordering of the lattice is<br />
found above 1.6 GPa from x-<br />
ray diffraction. The<br />
present calculations and<br />
measurements provide the first<br />
insight into the relative role of<br />
the different phonons in<br />
causing negative thermal<br />
expansion in Zn(CN) 2 .<br />
154 BASIC RESEARCH