IGCAR : Annual Report - Indira Gandhi Centre for Atomic Research
IGCAR : Annual Report - Indira Gandhi Centre for Atomic Research
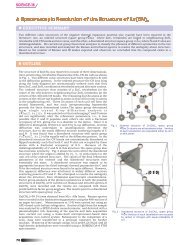
IGCAR : Annual Report - Indira Gandhi Centre for Atomic Research

Create successful ePaper yourself
Turn your PDF publications into a flip-book with our unique Google optimized e-Paper software.
IGC<br />
<strong>Annual</strong> <strong>Report</strong> 2007<br />
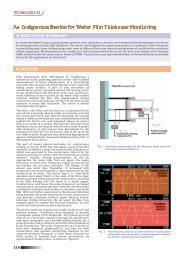
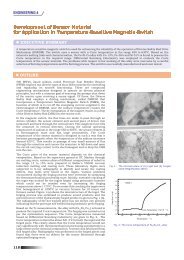
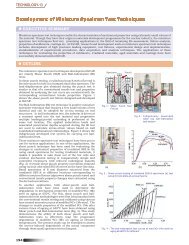
V.C.10. Single Chip Embedded Experimental<br />
Automation Design<br />
An inexpensive embedded<br />
automation design <strong>for</strong> Raman<br />
spectrometer system shown in<br />
Fig.1, has built with a single<br />
Programmable System On-<br />
Chip (PSoC), a Cypress Micro<br />
System's mixed array<br />
microcontroller. This<br />
automation system allows the<br />
on-line acquisition of<br />
spectroscopic data and the<br />
control of the experimental<br />
setup operation, using PC as a<br />
window based graphical user<br />
interface (GUI). The menu<br />
driven user-friendly software in<br />
virtual instrument (VI) control<br />
program written in LabVIEW<br />
ver.7.1, a graphical language,<br />
interacts with the embedded<br />
single chip design <strong>for</strong> the total<br />
automation of the experiment.<br />
The user friendly menu driven<br />
virtual instrument program<br />
interacts with the embedded<br />
PSoC design through its USBserial<br />
interface.<br />
Fig.2 shows the front panel of<br />
the PSoC based menu driven<br />
user-friendly virtual instrument<br />
program with a acquired<br />
Raman spectrum in zinc<br />
cyanide, Zr(CN) 2 acquired in<br />
the range of 2200 cm -1 to 2240<br />
cm -1 <strong>for</strong> a preset time of 5<br />
seconds in steps of 0.5 cm -1 .<br />
The menu driven GUI program<br />
has the facilities like (i) storing<br />
the data in the user specified<br />
file path, (ii) loading the<br />
previous spectrum <strong>for</strong>m the<br />
user file path, (iii) automatically<br />
configure the initial, final and<br />
step wave number on the graph<br />
immediately after the user entry,<br />
(iv) print spectrum, (v) clear<br />
spectrum and (vi) functioning<br />
Fig.1 Block diagram of raman spectrometer experimental automation setup.<br />
142 ENABLING TECHNOLOGIES