addressing uncertainty in oil and natural gas industry greenhouse
addressing uncertainty in oil and natural gas industry greenhouse
addressing uncertainty in oil and natural gas industry greenhouse

You also want an ePaper? Increase the reach of your titles
YUMPU automatically turns print PDFs into web optimized ePapers that Google loves.
S<strong>in</strong>ce an underst<strong>and</strong><strong>in</strong>g of the magnitude <strong>and</strong> sources of GHG emissions is critical to properly manag<strong>in</strong>g<br />
these emissions, employ<strong>in</strong>g a consistent approach can significantly improve <strong>in</strong>dustry-wide, comparable<br />
estimates of emissions, <strong>and</strong> emission reductions.<br />
Higher quality GHG data leads to higher certa<strong>in</strong>ty of emission assessments, <strong>and</strong> improved confidence <strong>in</strong><br />
the data reported. This is true for national <strong>and</strong> government assessments, <strong>and</strong> is also important at the<br />
entity, or facility level. To ensure that a company’s strategies <strong>and</strong> forward-look<strong>in</strong>g actions are based on<br />
the most robust data set <strong>and</strong> most appropriate computational methods, it is important that this data set <strong>and</strong><br />
method be based on four key factors (“The Four C’s”).<br />
Comparability, Consistency, Certa<strong>in</strong>ty, Confidence<br />
1.2 Overview of Uncerta<strong>in</strong>ty Term<strong>in</strong>ology<br />
The API <strong>in</strong> Chapter 13 of its Manual of Petroleum Measurement St<strong>and</strong>ards (MPMS), provides detailed<br />
guidance on statistical concepts <strong>and</strong> procedures for <strong>address<strong>in</strong>g</strong> the statistical procedures that should be<br />
followed when estimat<strong>in</strong>g a true quantity from measurements–or models–<strong>and</strong> when deriv<strong>in</strong>g the<br />
confidence <strong>in</strong>terval of the results (API, 1985). That chapter also exam<strong>in</strong>es sources of error <strong>and</strong><br />
recommends how to develop a statement of the overall range of <strong>uncerta<strong>in</strong>ty</strong> of the results obta<strong>in</strong>ed. Some<br />
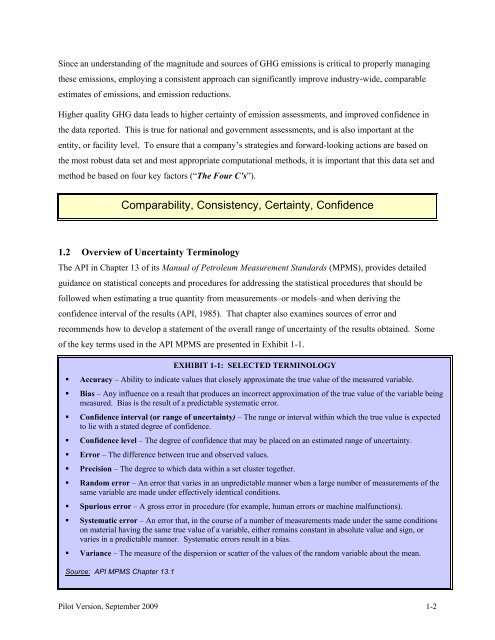
of the key terms used <strong>in</strong> the API MPMS are presented <strong>in</strong> Exhibit 1-1.<br />
EXHIBIT 1-1: SELECTED TERMINOLOGY<br />
• Accuracy – Ability to <strong>in</strong>dicate values that closely approximate the true value of the measured variable.<br />
• Bias – Any <strong>in</strong>fluence on a result that produces an <strong>in</strong>correct approximation of the true value of the variable be<strong>in</strong>g<br />
measured. Bias is the result of a predictable systematic error.<br />
• Confidence <strong>in</strong>terval (or range of <strong>uncerta<strong>in</strong>ty</strong>) – The range or <strong>in</strong>terval with<strong>in</strong> which the true value is expected<br />
to lie with a stated degree of confidence.<br />
• Confidence level – The degree of confidence that may be placed on an estimated range of <strong>uncerta<strong>in</strong>ty</strong>.<br />
• Error – The difference between true <strong>and</strong> observed values.<br />
• Precision – The degree to which data with<strong>in</strong> a set cluster together.<br />
• R<strong>and</strong>om error – An error that varies <strong>in</strong> an unpredictable manner when a large number of measurements of the<br />
same variable are made under effectively identical conditions.<br />
• Spurious error – A gross error <strong>in</strong> procedure (for example, human errors or mach<strong>in</strong>e malfunctions).<br />
• Systematic error – An error that, <strong>in</strong> the course of a number of measurements made under the same conditions<br />
on material hav<strong>in</strong>g the same true value of a variable, either rema<strong>in</strong>s constant <strong>in</strong> absolute value <strong>and</strong> sign, or<br />
varies <strong>in</strong> a predictable manner. Systematic errors result <strong>in</strong> a bias.<br />
• Variance – The measure of the dispersion or scatter of the values of the r<strong>and</strong>om variable about the mean.<br />
Source: API MPMS Chapter 13.1<br />
Pilot Version, September 2009 1-2