FY12 Adopted Operating Budget & Capital Improvement Budget
FY12 Adopted Operating Budget & Capital Improvement Budget
FY12 Adopted Operating Budget & Capital Improvement Budget

Create successful ePaper yourself
Turn your PDF publications into a flip-book with our unique Google optimized e-Paper software.
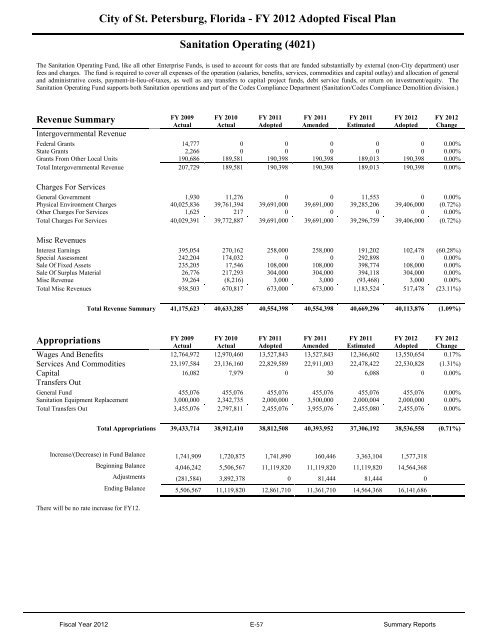
City of St. Petersburg, Florida - FY 2012 <strong>Adopted</strong> Fiscal Plan<br />
Sanitation <strong>Operating</strong> (4021)<br />
The Sanitation <strong>Operating</strong> Fund, like all other Enterprise Funds, is used to account for costs that are funded substantially by external (non-City department) user<br />
fees and charges. The fund is required to cover all expenses of the operation (salaries, benefits, services, commodities and capital outlay) and allocation of general<br />
and administrative costs, payment-in-lieu-of-taxes, as well as any transfers to capital project funds, debt service funds, or return on investment/equity. The<br />
Sanitation <strong>Operating</strong> Fund supports both Sanitation operations and part of the Codes Compliance Department (Sanitation/Codes Compliance Demolition division.)<br />
Revenue Summary<br />
FY 2009<br />
Actual<br />
FY 2010<br />
Actual<br />
FY 2011<br />
<strong>Adopted</strong><br />
FY 2011<br />
Amended<br />
FY 2011<br />
Estimated<br />
FY 2012<br />
<strong>Adopted</strong><br />
FY 2012<br />
Change<br />
Intergovernmental Revenue<br />
Federal Grants 14,777 0 0 0 0 0 0.00%<br />
State Grants 2,266 0 0 0 0 0 0.00%<br />
Grants From Other Local Units 190,686 189,581 190,398 190,398 189,013 190,398 0.00%<br />
Total Intergovernmental Revenue 207,729 189,581 190,398 190,398 189,013 190,398 0.00%<br />
Charges For Services<br />
General Government 1,930 11,276 0 0 11,553 0 0.00%<br />
Physical Environment Charges 40,025,836 39,761,394 39,691,000 39,691,000 39,285,206 39,406,000 (0.72%)<br />
Other Charges For Services 1,625 217 0 0 0 0 0.00%<br />
Total Charges For Services 40,029,391 39,772,887 39,691,000 39,691,000 39,296,759 39,406,000 (0.72%)<br />
Misc Revenues<br />
Interest Earnings 395,054 270,162 258,000 258,000 191,202 102,478 (60.28%)<br />
Special Assessment 242,204 174,032 0 0 292,898 0 0.00%<br />
Sale Of Fixed Assets 235,205 17,546 108,000 108,000 398,774 108,000 0.00%<br />
Sale Of Surplus Material 26,776 217,293 304,000 304,000 394,118 304,000 0.00%<br />
Misc Revenue 39,264 (8,216) 3,000 3,000 (93,468) 3,000 0.00%<br />
Total Misc Revenues 938,503 670,817 673,000 673,000 1,183,524 517,478 (23.11%)<br />
Total Revenue Summary 41,175,623 40,633,285 40,554,398 40,554,398 40,669,296 40,113,876 (1.09%)<br />
Appropriations<br />
FY 2009<br />
Actual<br />
FY 2010<br />
Actual<br />
FY 2011<br />
<strong>Adopted</strong><br />
FY 2011<br />
Amended<br />
FY 2011<br />
Estimated<br />
FY 2012<br />
<strong>Adopted</strong><br />
FY 2012<br />
Change<br />
Wages And Benefits 12,764,972 12,970,460 13,527,843 13,527,843 12,366,602 13,550,654 0.17%<br />
Services And Commodities 23,197,584 23,136,160 22,829,589 22,911,003 22,478,422 22,530,828 (1.31%)<br />
<strong>Capital</strong> 16,082 7,979 0 30 6,088 0 0.00%<br />
Transfers Out<br />
General Fund 455,076 455,076 455,076 455,076 455,076 455,076 0.00%<br />
Sanitation Equipment Replacement 3,000,000 2,342,735 2,000,000 3,500,000 2,000,004 2,000,000 0.00%<br />
Total Transfers Out 3,455,076 2,797,811 2,455,076 3,955,076 2,455,080 2,455,076 0.00%<br />
Total Appropriations 39,433,714 38,912,410 38,812,508 40,393,952 37,306,192 38,536,558 (0.71%)<br />
Increase/(Decrease) in Fund Balance 1,741,909 1,720,875 1,741,890 160,446 3,363,104 1,577,318<br />
Beginning Balance 4,046,242 5,506,567 11,119,820 11,119,820 11,119,820 14,564,368<br />
Adjustments (281,584) 3,892,378 0 81,444 81,444 0<br />
Ending Balance 5,506,567 11,119,820 12,861,710 11,361,710 14,564,368 16,141,686<br />
There will be no rate increase for <strong>FY12</strong>.<br />
Fiscal Year 2012 E-57 Summary Reports