FY12 Adopted Operating Budget & Capital Improvement Budget
FY12 Adopted Operating Budget & Capital Improvement Budget
FY12 Adopted Operating Budget & Capital Improvement Budget

Create successful ePaper yourself
Turn your PDF publications into a flip-book with our unique Google optimized e-Paper software.
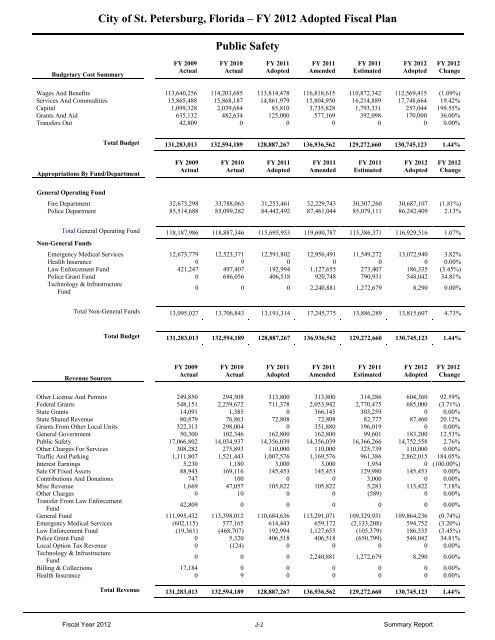
City of St. Petersburg, Florida – FY 2012 <strong>Adopted</strong> Fiscal Plan<br />
Public Safety<br />
<strong>Budget</strong>ary Cost Summary<br />
FY 2009<br />
Actual<br />
FY 2010<br />
Actual<br />
FY 2011<br />
<strong>Adopted</strong><br />
FY 2011<br />
Amended<br />
FY 2011<br />
Estimated<br />
FY 2012<br />
<strong>Adopted</strong><br />
FY 2012<br />
Change<br />
Wages And Benefits 113,640,256 114,203,685 113,814,478 116,818,615 110,872,342 112,569,415 (1.09%)<br />
Services And Commodities 15,865,488 15,868,187 14,861,979 15,804,950 16,214,889 17,748,664 19.42%<br />
<strong>Capital</strong> 1,099,328 2,039,684 85,810 3,735,828 1,793,331 257,044 199.55%<br />
Grants And Aid 635,132 482,634 125,000 577,169 392,098 170,000 36.00%<br />
Transfers Out 42,809 0 0 0 0 0 0.00%<br />
Total <strong>Budget</strong> 131,283,013 132,594,189 128,887,267 136,936,562 129,272,660 130,745,123 1.44%<br />
Appropriations By Fund/Department<br />
FY 2009<br />
Actual<br />
FY 2010<br />
Actual<br />
FY 2011<br />
<strong>Adopted</strong><br />
FY 2011<br />
Amended<br />
FY 2011<br />
Estimated<br />
FY 2012<br />
<strong>Adopted</strong><br />
FY 2012<br />
Change<br />
General <strong>Operating</strong> Fund<br />
Fire Department 32,673,298 33,788,063 31,253,461 32,229,743 30,307,260 30,687,107 (1.81%)<br />
Police Department 85,514,688 85,099,282 84,442,492 87,461,044 85,079,111 86,242,409 2.13%<br />
Total General <strong>Operating</strong> Fund 118,187,986 118,887,346 115,695,953 119,690,787 115,386,371 116,929,516 1.07%<br />
Non-General Funds<br />
Emergency Medical Services 12,673,779 12,523,371 12,591,802 12,956,491 11,549,272 13,072,940 3.82%<br />
Health Insurance 0 9 0 0 0 0 0.00%<br />
Law Enforcement Fund 421,247 497,407 192,994 1,127,655 273,407 186,335 (3.45%)<br />
Police Grant Fund 0 686,056 406,518 920,748 790,931 548,042 34.81%<br />
Technology & Infrastructure<br />
Fund<br />
0 0 0 2,240,881 1,272,679 8,290 0.00%<br />
Total Non-General Funds 13,095,027 13,706,843 13,191,314 17,245,775 13,886,289 13,815,607 4.73%<br />
Total <strong>Budget</strong> 131,283,013 132,594,189 128,887,267 136,936,562 129,272,660 130,745,123 1.44%<br />
Revenue Sources<br />
FY 2009<br />
Actual<br />
FY 2010<br />
Actual<br />
FY 2011<br />
<strong>Adopted</strong><br />
FY 2011<br />
Amended<br />
FY 2011<br />
Estimated<br />
FY 2012<br />
<strong>Adopted</strong><br />
FY 2012<br />
Change<br />
Other License And Permits 249,850 294,508 313,800 313,800 314,286 604,360 92.59%<br />
Federal Grants 548,151 2,259,672 711,378 2,053,942 2,770,475 685,000 (3.71%)<br />
State Grants 14,091 1,385 0 366,145 303,259 0 0.00%<br />
State Shared Revenue 80,879 76,863 72,808 72,808 82,777 87,460 20.12%<br />
Grants From Other Local Units 322,313 298,004 0 351,880 196,019 0 0.00%<br />
General Government 50,300 102,346 162,800 162,800 99,601 183,200 12.53%<br />
Public Safety 17,066,802 14,034,937 14,356,039 14,356,039 16,366,266 14,752,558 2.76%<br />
Other Charges For Services 308,282 275,893 110,000 110,000 325,739 110,000 0.00%<br />
Traffic And Parking 1,111,807 1,521,443 1,007,576 1,169,576 961,386 2,862,015 184.05%<br />
Interest Earnings 5,230 1,180 3,000 3,000 1,954 0 (100.00%)<br />
Sale Of Fixed Assets 88,943 169,116 145,453 145,453 129,980 145,453 0.00%<br />
Contributions And Donations 747 100 0 0 3,000 0 0.00%<br />
Misc Revenue 1,669 47,057 105,822 105,822 5,283 113,422 7.18%<br />
Other Charges 0 10 0 0 (589) 0 0.00%<br />
Transfer From Law Enforcement<br />
42,809 0 0 0 0 0 0.00%<br />
Fund<br />
General Fund 111,995,432 113,398,012 110,684,636 113,291,071 109,329,931 109,864,236 (0.74%)<br />
Emergency Medical Services (602,115) 577,165 614,443 659,172 (2,133,208) 594,752 (3.20%)<br />
Law Enforcement Fund (19,361) (468,707) 192,994 1,127,655 (105,379) 186,335 (3.45%)<br />
Police Grant Fund 0 5,320 406,518 406,518 (650,799) 548,042 34.81%<br />
Local Option Tax Revenue 0 (124) 0 0 0 0 0.00%<br />
Technology & Infrastructure<br />
0 0 0 2,240,881 1,272,679 8,290 0.00%<br />
Fund<br />
Billing & Collections 17,184 0 0 0 0 0 0.00%<br />
Health Insurance 0 9 0 0 0 0 0.00%<br />
Total Revenue 131,283,013 132,594,189 128,887,267 136,936,562 129,272,660 130,745,123 1.44%<br />
Fiscal Year 2012 J-2 Summary Report