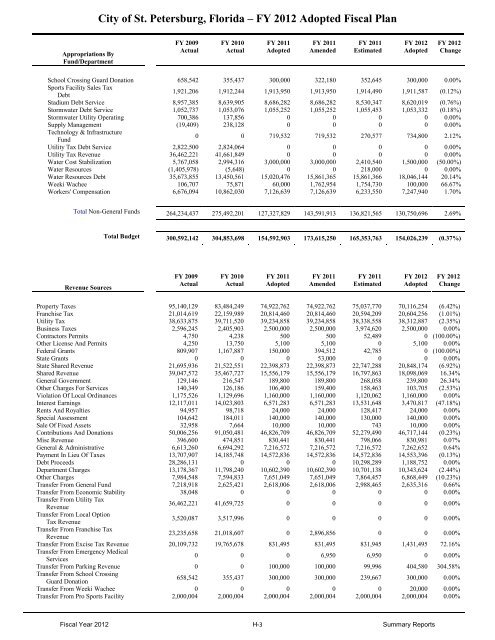
City of St. Petersburg, Florida – FY 2012 <strong>Adopted</strong> Fiscal Plan Appropriations By Fund/Department FY 2009 Actual FY 2010 Actual FY 2011 <strong>Adopted</strong> FY 2011 Amended FY 2011 Estimated FY 2012 <strong>Adopted</strong> FY 2012 Change School Crossing Guard Donation 658,542 355,437 300,000 322,180 352,645 300,000 0.00% Sports Facility Sales Tax Debt 1,921,206 1,912,244 1,913,950 1,913,950 1,914,490 1,911,587 (0.12%) Stadium Debt Service 8,957,385 8,639,905 8,686,282 8,686,282 8,530,347 8,620,019 (0.76%) Stormwater Debt Service 1,052,737 1,053,076 1,055,252 1,055,252 1,055,453 1,053,332 (0.18%) Stormwater Utility <strong>Operating</strong> 700,386 137,856 0 0 0 0 0.00% Supply Management (19,409) 238,128 0 0 0 0 0.00% Technology & Infrastructure Fund 0 0 719,532 719,532 270,577 734,800 2.12% Utility Tax Debt Service 2,822,500 2,824,064 0 0 0 0 0.00% Utility Tax Revenue 36,462,221 41,661,849 0 0 0 0 0.00% Water Cost Stabilization 5,767,058 2,994,316 3,000,000 3,000,000 2,410,540 1,500,000 (50.00%) Water Resources (1,405,978) (5,648) 0 0 218,000 0 0.00% Water Resources Debt 35,673,855 13,450,561 15,020,476 15,861,365 15,861,366 18,046,144 20.14% Weeki Wachee 106,707 75,871 60,000 1,762,954 1,754,730 100,000 66.67% Workers' Compensation 6,676,094 10,862,030 7,126,639 7,126,639 6,233,550 7,247,940 1.70% Total Non-General Funds 264,234,437 275,492,201 127,327,829 143,591,913 136,821,565 130,750,696 2.69% Total <strong>Budget</strong> 300,592,142 304,853,698 154,592,903 173,615,250 165,353,763 154,026,239 (0.37%) Revenue Sources FY 2009 Actual FY 2010 Actual FY 2011 <strong>Adopted</strong> FY 2011 Amended FY 2011 Estimated FY 2012 <strong>Adopted</strong> FY 2012 Change Property Taxes 95,140,129 83,484,249 74,922,762 74,922,762 75,037,770 70,116,254 (6.42%) Franchise Tax 21,014,619 22,159,989 20,814,460 20,814,460 20,594,209 20,604,256 (1.01%) Utility Tax 38,633,875 39,711,520 39,234,858 39,234,858 38,338,558 38,312,887 (2.35%) Business Taxes 2,596,245 2,405,903 2,500,000 2,500,000 3,974,620 2,500,000 0.00% Contractors Permits 4,750 4,238 500 500 52,489 0 (100.00%) Other License And Permits 4,250 13,750 5,100 5,100 0 5,100 0.00% Federal Grants 809,907 1,167,887 150,000 394,512 42,785 0 (100.00%) State Grants 0 0 0 53,000 0 0 0.00% State Shared Revenue 21,695,936 21,522,551 22,398,873 22,398,873 22,747,288 20,848,174 (6.92%) Shared Revenue 39,047,572 35,467,727 15,556,179 15,556,179 16,797,863 18,098,069 16.34% General Government 129,146 216,547 189,800 189,800 268,058 239,800 26.34% Other Charges For Services 140,349 126,186 106,400 159,400 158,463 103,705 (2.53%) Violation Of Local Ordinances 1,175,526 1,129,696 1,160,000 1,160,000 1,120,062 1,160,000 0.00% Interest Earnings 12,117,011 14,023,803 6,571,283 6,571,283 13,531,648 3,470,817 (47.18%) Rents And Royalties 94,957 98,718 24,000 24,000 128,417 24,000 0.00% Special Assessment 104,642 184,011 140,000 140,000 130,000 140,000 0.00% Sale Of Fixed Assets 32,958 7,664 10,000 10,000 743 10,000 0.00% Contributions And Donations 50,006,256 91,050,481 46,826,709 46,826,709 52,279,490 46,717,144 (0.23%) Misc Revenue 396,600 474,851 830,441 830,441 798,066 830,981 0.07% General & Administrative 6,613,260 6,694,292 7,216,572 7,216,572 7,216,572 7,262,652 0.64% Payment In Lieu Of Taxes 13,707,907 14,185,748 14,572,836 14,572,836 14,572,836 14,553,396 (0.13%) Debt Proceeds 28,286,131 0 0 0 10,298,289 1,188,752 0.00% Department Charges 13,178,367 11,798,240 10,602,390 10,602,390 10,701,138 10,343,624 (2.44%) Other Charges 7,984,548 7,594,833 7,651,049 7,651,049 7,864,457 6,868,449 (10.23%) Transfer From General Fund 7,218,918 2,625,421 2,618,006 2,618,006 2,988,465 2,635,316 0.66% Transfer From Economic Stability 38,048 0 0 0 0 0 0.00% Transfer From Utility Tax 36,462,221 41,659,725 0 0 0 0 0.00% Revenue Transfer From Local Option 3,520,087 3,517,996 0 0 0 0 0.00% Tax Revenue Transfer From Franchise Tax 23,235,658 21,018,607 0 2,896,856 0 0 0.00% Revenue Transfer From Excise Tax Revenue 20,109,732 19,765,678 831,495 831,495 831,945 1,431,495 72.16% Transfer From Emergency Medical 0 0 0 6,950 6,950 0 0.00% Services Transfer From Parking Revenue 0 0 100,000 100,000 99,996 404,580 304.58% Transfer From School Crossing 658,542 355,437 300,000 300,000 239,667 300,000 0.00% Guard Donation Transfer From Weeki Wachee 0 0 0 0 0 20,000 0.00% Transfer From Pro Sports Facility 2,000,004 2,000,004 2,000,004 2,000,004 2,000,004 2,000,004 0.00% Fiscal Year 2012 H-3 Summary Reports
City of St. Petersburg, Florida – FY 2012 <strong>Adopted</strong> Fiscal Plan Revenue Sources FY 2009 Actual FY 2010 Actual FY 2011 <strong>Adopted</strong> FY 2011 Amended FY 2011 Estimated FY 2012 <strong>Adopted</strong> FY 2012 Change Transfer From Downtown Redevelopment 5,645,697 7,501,854 7,533,729 7,562,729 7,562,729 8,169,124 8.43% District Transfer From Community Development 285,605 841,153 828,632 828,632 758,347 780,431 (5.82%) Block Grant Transfer From Community Redevelopment 9,259,610 8,867,559 6,712,750 6,712,750 6,885,266 6,703,500 (0.14%) District Transfer From Stadium Debt 549,888 242,873 300,000 300,000 143,514 245,000 (18.33%) Service Transfer From Weeki Wachee 155,000 0 0 0 0 0 0.00% <strong>Capital</strong> <strong>Improvement</strong>s Transfer From Water Resources 12,485,618 14,922,808 14,923,400 14,923,400 15,838,345 17,130,250 14.79% Transfer From Water Cost Stabilization 0 0 0 0 2,176,756 0 0.00% Transfer From Stormwater Utility 1,055,061 1,057,856 1,053,000 1,053,000 1,053,000 1,058,000 0.47% <strong>Operating</strong> Transfer From Sanitation <strong>Operating</strong> 455,076 797,807 455,076 455,076 455,076 455,076 0.00% Transfer From Airport <strong>Operating</strong> 0 0 50,000 50,000 50,004 50,000 0.00% Transfer From Marina <strong>Operating</strong> 300,000 300,000 300,000 300,000 300,000 310,000 3.33% Transfer From Jamestown Complex 0 0 35,000 35,000 35,004 35,000 0.00% Transfer From Fleet Management 0 721,716 0 0 0 0 0.00% Transfer From Equipment Replacement 0 1,757,828 0 0 0 0 0.00% Transfer From Information 19,000 1,457,833 300,000 300,000 300,000 200,000 (33.33%) & Communication Services Transfer From PC Replacement 0 3,638,761 0 0 (155,906) 0 0.00% Transfer From Radio Replacement 0 1,162,851 0 0 0 0 0.00% Transfer From Supply Management 0 249,523 0 0 0 0 0.00% Transfer From Print Shop 0 0 0 0 (50,908) 0 0.00% Transfer From Life Insurance 0 216,035 0 0 0 0 0.00% Transfer From General Liabilities 0 12,111,560 0 0 0 0 0.00% Claims Transfer From Commercial Insurance 0 1,533,744 0 0 0 0 0.00% Transfer From Billing & Collections 0 1,466,197 0 0 0 0 0.00% General Fund (159,355,251) (166,585,993) (156,138,000) (156,134,849) (155,631,045) (155,144,301) (0.64%) Franchise Tax Revenue 3,847,252 (797,992) 0 2,896,856 0 0 0.00% Utility Tax Revenue (2,171,642) 9,373,356 0 0 0 0 0.00% Water Resources (1,885,245) (544,263) (51,532) (51,532) (2,025,512) (20,469) (60.28%) Economic Development 0 12,636 0 0 0 0 0.00% Preservation Reserve (3,918) (855) (5,000) (5,000) (408) 0 (100.00%) Billing & Collections (337,856) 1,460,370 98,064 71,667 (419,372) 21,138 (78.44%) Information & Communication (895,987) 1,894,525 670,812 1,239,658 59,024 560,517 (16.44%) Services Parking Revenue 145,132 307,097 315,342 320,342 277,513 514,190 63.06% Excise Tax Revenue 2,165,866 266,975 560,710 560,710 630,594 1,431,495 155.30% Stadium Debt Service (133,918) (148,375) (160,875) (160,875) 18,311 (172,861) 7.45% Pro Sports Facility (1,305) (44) (9,996) (9,996) (7) (3,968) (60.30%) Community Development Block (74) 0 0 0 0 0 0.00% Grant Community Redevelopment District (765,920) 2,501,388 (894,525) (894,525) (1,270,738) (1,270,181) 42.00% Bayboro Harbor Tax Increment 0 (151,662) (95,458) (95,458) (68,723) (38,316) (59.86%) District Local Option Tax Revenue 2,871,901 3,782,900 0 4,503,245 4,502,252 0 0.00% Intown West Tax Increment 0 (502,419) (326,389) (326,389) (313,314) (215,912) (33.85%) District General Liabilities Claims (3,082,359) 10,243,576 12,799 248,799 352,781 15,637 22.17% Health Facilities Authority (9,912) (4,853) 0 0 158 0 0.00% Industrial Development (482) 123,605 0 0 0 0 0.00% Weeki Wachee (1,165,055) (577,728) (240,000) 1,462,954 (100,525) (19,160) (92.02%) Marina <strong>Operating</strong> 0 (286,930) 0 0 0 0 0.00% Workers' Compensation 422,494 (2,250,952) (3,261) (3,261) (1,347,403) 189,849 (5921.80 %) Stormwater Utility <strong>Operating</strong> 546,102 118,442 0 0 (118,837) 0 0.00% Water Resources Debt (5,174,780) (1,623,133) (52,782) 788,107 (5,948,415) (423,969) 703.25% Sanitation <strong>Operating</strong> 0 342,731 0 0 0 0 0.00% Sanitation Equipment Replacement (19) (342,731) 0 0 0 0 0.00% PC Replacement (630,169) 3,392,137 0 36,106 (162,000) 0 0.00% Building Permit Special Revenue (31,064) (2,839) 0 0 (242) 0 0.00% Commercial Insurance (1353.50 (97,560) 1,276,446 (157) (157) (234,557) 1,968 %) Community Housing Donation (44,527) (89,614) 0 0 (30,832) 0 0.00% Technology & Infrastructure 0 (10,357,139) (359,468) (359,468) (518,716) (42,996) (88.04%) Fund Downtown Redevelopment District (3,702,888) 2,313,237 820,979 5,967,685 843,136 1,465,624 78.52% Assessments Revenue 114,723 (45,100) (13,874) (13,874) 6,144 (57,757) 316.30% Fiscal Year 2012 H-4 Summary Reports
- Page 1 and 2:
CITY OF ST. PETERSBURG FLORIDA Adop
- Page 3 and 4:
CITY OF ST. PETERSBURG OPERATING BU
- Page 5 and 6:
USING THIS ONLINE VERSION: THROUGHO
- Page 7 and 8:
City of St. Petersburg, Florida- FY
- Page 9 and 10:
City of St. Petersburg, Florida- FY
- Page 11 and 12:
Section A EXECUTIVE SUMMARY
- Page 13 and 14:
City of St. Petersburg, Florida - F
- Page 15 and 16:
City of St. Petersburg, Florida - F
- Page 17 and 18:
City of St. Petersburg, Florida - F
- Page 19 and 20:
City of St. Petersburg, Florida - F
- Page 21 and 22:
City of St. Petersburg, Florida - F
- Page 23 and 24:
City of St. Petersburg, Florida - F
- Page 25 and 26:
City of St. Petersburg, Florida - F
- Page 27 and 28:
City of St. Petersburg, Florida - F
- Page 29 and 30:
City of St. Petersburg, Florida - F
- Page 31 and 32:
City of St. Petersburg, Florida - F
- Page 33 and 34:
City of St. Petersburg, Florida - F
- Page 35 and 36:
City of St. Petersburg, Florida - F
- Page 37 and 38:
City of St. Petersburg, Florida - F
- Page 39 and 40:
City of St. Petersburg, Florida - F
- Page 41 and 42:
City of St. Petersburg, Florida - F
- Page 43 and 44:
City of St. Petersburg, Florida - F
- Page 45 and 46:
City of St. Petersburg, Florida - F
- Page 47 and 48:
City of St. Petersburg, Florida - F
- Page 49 and 50:
City of St. Petersburg, Florida - F
- Page 51 and 52:
City of St. Petersburg, Florida - F
- Page 53 and 54:
City of St. Petersburg, Florida - F
- Page 55 and 56:
Section B FISCAL POLICIES
- Page 57 and 58:
City of St. Petersburg, Florida - F
- Page 59 and 60:
City of St. Petersburg, Florida - F
- Page 61 and 62:
City of St. Petersburg, Florida - F
- Page 63 and 64:
City of St. Petersburg, Florida - F
- Page 65 and 66:
City of St. Petersburg, Florida - F
- Page 67 and 68:
City of St. Petersburg, Florida - F
- Page 69 and 70:
City of St. Petersburg, Florida - F
- Page 71 and 72:
City of St. Petersburg, Florida - F
- Page 73 and 74:
City of St. Petersburg, Florida - F
- Page 75 and 76:
City of St. Petersburg, Florida - F
- Page 77 and 78:
Section D REVENUE HIGHLIGHTS
- Page 79 and 80:
City of St. Petersburg, Florida - F
- Page 81 and 82:
Utility Taxes: City of St. Petersbu
- Page 83 and 84:
City of St. Petersburg, Florida - F
- Page 85 and 86:
City of St. Petersburg, Florida - F
- Page 87 and 88:
City of St. Petersburg, Florida - F
- Page 89 and 90:
City of St. Petersburg, Florida - F
- Page 91 and 92:
City of St. Petersburg, Florida - F
- Page 93 and 94:
City of St. Petersburg, Florida - F
- Page 95 and 96:
City of St. Petersburg, Florida - F
- Page 97 and 98:
City of St. Petersburg, Florida - F
- Page 99 and 100:
City of St. Petersburg, Florida - F
- Page 101 and 102:
City of St. Petersburg, Florida - F
- Page 103 and 104:
City of St. Petersburg, Florida - F
- Page 105 and 106:
City of St. Petersburg, Florida - F
- Page 107 and 108:
City of St. Petersburg, Florida - F
- Page 109 and 110:
City of St. Petersburg, Florida - F
- Page 111 and 112:
City of St. Petersburg, Florida - F
- Page 113 and 114:
City of St. Petersburg, Florida - F
- Page 115 and 116:
City of St. Petersburg, Florida - F
- Page 117 and 118:
City of St. Petersburg, Florida - F
- Page 119 and 120:
City of St. Petersburg, Florida - F
- Page 121 and 122:
City of St. Petersburg, Florida - F
- Page 123 and 124:
City of St. Petersburg, Florida - F
- Page 125 and 126:
City of St. Petersburg, Florida - F
- Page 127 and 128:
City of St. Petersburg, Florida - F
- Page 129 and 130:
City of St. Petersburg, Florida - F
- Page 131 and 132:
City of St. Petersburg, Florida - F
- Page 133 and 134:
City of St. Petersburg, Florida - F
- Page 135 and 136:
City of St. Petersburg, Florida - F
- Page 137 and 138:
City of St. Petersburg, Florida - F
- Page 139 and 140:
City of St. Petersburg, Florida - F
- Page 141 and 142:
City of St. Petersburg, Florida - F
- Page 143 and 144:
City of St. Petersburg, Florida - F
- Page 145 and 146:
City of St. Petersburg, Florida - F
- Page 147 and 148:
City of St. Petersburg, Florida - F
- Page 149 and 150: City of St. Petersburg, Florida - F
- Page 151 and 152: City of St. Petersburg, Florida - F
- Page 153 and 154: City of St. Petersburg, Florida - F
- Page 155 and 156: City of St. Petersburg, Florida - F
- Page 157 and 158: City of St. Petersburg, Florida - F
- Page 159 and 160: City of St. Petersburg, Florida - F
- Page 161 and 162: City of St. Petersburg, Florida - F
- Page 163 and 164: City of St. Petersburg, Florida - F
- Page 165 and 166: City of St. Petersburg, Florida - F
- Page 167 and 168: City of St. Petersburg, Florida - F
- Page 169 and 170: Section F DEBT SERVICE
- Page 171 and 172: City of St. Petersburg, Florida - F
- Page 173 and 174: Section G CITY DEVELOPMENT
- Page 175 and 176: City of St. Petersburg, Florida - F
- Page 177 and 178: City of St. Petersburg, Florida - F
- Page 179 and 180: City of St. Petersburg, Florida - F
- Page 181 and 182: City of St. Petersburg, Florida - F
- Page 183 and 184: City of St. Petersburg, Florida - F
- Page 185 and 186: City of St. Petersburg, Florida - F
- Page 187 and 188: City of St. Petersburg, Florida - F
- Page 189 and 190: Department Mission Statement City o
- Page 191 and 192: City of St. Petersburg, Florida - F
- Page 193 and 194: Department Mission Statement City o
- Page 195 and 196: Department Mission Statement City o
- Page 197 and 198: Section H GENERAL GOVERNMENT
- Page 199: City of St. Petersburg, Florida - F
- Page 203 and 204: City of St. Petersburg, Florida - F
- Page 205 and 206: Department Mission Statement City o
- Page 207 and 208: Department Mission Statement City o
- Page 209 and 210: Department Mission Statement City o
- Page 211 and 212: Department Mission Statement City o
- Page 213 and 214: City of St. Petersburg, Florida - F
- Page 215 and 216: City of St. Petersburg, Florida - F
- Page 217 and 218: City of St. Petersburg, Florida - F
- Page 219 and 220: City of St. Petersburg, Florida - F
- Page 221 and 222: City of St. Petersburg, Florida - F
- Page 223 and 224: City of St. Petersburg, Florida - F
- Page 225 and 226: City of St. Petersburg, Florida - F
- Page 227 and 228: City of St. Petersburg, Florida - F
- Page 229 and 230: City of St. Petersburg, Florida - F
- Page 231 and 232: City of St. Petersburg, Florida - F
- Page 233 and 234: City of St. Petersburg, Florida - F
- Page 235 and 236: City of St. Petersburg, Florida - F
- Page 237 and 238: City of St. Petersburg, Florida - F
- Page 239 and 240: City of St. Petersburg, Florida - F
- Page 241 and 242: City of St. Petersburg, Florida - F
- Page 243 and 244: City of St. Petersburg, Florida - F
- Page 245 and 246: City of St. Petersburg, Florida - F
- Page 247 and 248: City of St. Petersburg, Florida - F
- Page 249 and 250: City of St. Petersburg, Florida - F
- Page 251 and 252:
City of St. Petersburg, Florida - F
- Page 253 and 254:
Section J PUBLIC SAFETY
- Page 255 and 256:
City of St. Petersburg, Florida - F
- Page 257 and 258:
City of St. Petersburg, Florida - F
- Page 259 and 260:
City of St. Petersburg, Florida - F
- Page 261 and 262:
City of St. Petersburg, Florida - F
- Page 263 and 264:
City of St. Petersburg, Florida - F
- Page 265 and 266:
Section K PUBLIC WORKS
- Page 267 and 268:
City of St. Petersburg, Florida - F
- Page 269 and 270:
City of St. Petersburg, Florida - F
- Page 271 and 272:
City of St. Petersburg, Florida - F
- Page 273 and 274:
Department Mission Statement City o
- Page 275 and 276:
Department Mission Statement City o
- Page 277 and 278:
City of St. Petersburg, Florida - F
- Page 279 and 280:
Department Mission Statement City o
- Page 281 and 282:
Objective and Performance Measure C
- Page 283 and 284:
City of St. Petersburg, Florida - F
- Page 285 and 286:
City of St. Petersburg, Florida - F
- Page 287 and 288:
City of St. Petersburg, Florida - F
- Page 289 and 290:
Section L Capital Improvement Progr
- Page 291 and 292:
City of St. Petersburg, Florida - F
- Page 293 and 294:
Section M Capital Improvement Progr
- Page 295 and 296:
City of St. Petersburg, Florida - F
- Page 297 and 298:
City of St. Petersburg, Florida - F
- Page 299 and 300:
City of St. Petersburg, Florida - F
- Page 301 and 302:
City of St. Petersburg, Florida - F
- Page 303 and 304:
City of St. Petersburg, Florida - F
- Page 305 and 306:
City of St. Petersburg, Florida - F
- Page 307 and 308:
City of St. Petersburg, Florida - F
- Page 309 and 310:
City of St. Petersburg, Florida - F
- Page 311 and 312:
City of St. Petersburg, Florida - F
- Page 313 and 314:
City of St. Petersburg, Florida - F
- Page 315 and 316:
City of St. Petersburg, Florida - F
- Page 317 and 318:
City of St. Petersburg, Florida - F
- Page 319 and 320:
City of St. Petersburg, Florida - F
- Page 321 and 322:
Project Descriptions City of St. Pe
- Page 323 and 324:
City of St. Petersburg, Florida - F
- Page 325 and 326:
City of St. Petersburg, Florida - F
- Page 327 and 328:
City of St. Petersburg, Florida - F
- Page 329 and 330:
City of St. Petersburg, Florida - F
- Page 331 and 332:
City of St. Petersburg, Florida - F
- Page 333 and 334:
City of St. Petersburg, Florida - F
- Page 335 and 336:
City of St. Petersburg, Florida - F
- Page 337 and 338:
City of St. Petersburg, Florida - F
- Page 339 and 340:
City of St. Petersburg, Florida - F
- Page 341 and 342:
City of St. Petersburg, Florida - F
- Page 343 and 344:
City of St. Petersburg, Florida - F
- Page 345 and 346:
City of St. Petersburg, Florida - F
- Page 347 and 348:
City of St. Petersburg, Florida - F
- Page 349 and 350:
City of St. Petersburg, Florida - F
- Page 351 and 352:
City of St. Petersburg, Florida - F
- Page 353 and 354:
Section Q Capital Improvement Progr
- Page 355 and 356:
City of St. Petersburg, Florida - F
- Page 357 and 358:
City of St. Petersburg, Florida - F
- Page 359 and 360:
City of St. Petersburg, Florida - F
- Page 361:
APPENDICES
- Page 371 and 372:
City of St. Petersburg, Florida - F
- Page 373 and 374:
City of St. Petersburg, Florida - F
- Page 375 and 376:
City of St. Petersburg, Florida - F
- Page 377 and 378:
City of St. Petersburg, Florida- FY
- Page 379:
Look At What We Can Accomplish! ST.