FY12 Adopted Operating Budget & Capital Improvement Budget
FY12 Adopted Operating Budget & Capital Improvement Budget
FY12 Adopted Operating Budget & Capital Improvement Budget

You also want an ePaper? Increase the reach of your titles
YUMPU automatically turns print PDFs into web optimized ePapers that Google loves.
Department Mission Statement<br />
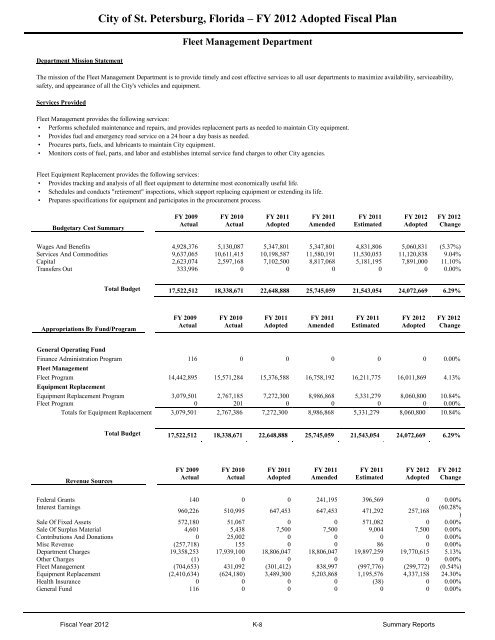
City of St. Petersburg, Florida – FY 2012 <strong>Adopted</strong> Fiscal Plan<br />
Fleet Management Department<br />
The mission of the Fleet Management Department is to provide timely and cost effective services to all user departments to maximize availability, serviceability,<br />
safety, and appearance of all the City's vehicles and equipment.<br />
Services Provided<br />
Fleet Management provides the following services:<br />
• Performs scheduled maintenance and repairs, and provides replacement parts as needed to maintain City equipment.<br />
• Provides fuel and emergency road service on a 24 hour a day basis as needed.<br />
• Procures parts, fuels, and lubricants to maintain City equipment.<br />
• Monitors costs of fuel, parts, and labor and establishes internal service fund charges to other City agencies.<br />
Fleet Equipment Replacement provides the following services:<br />
• Provides tracking and analysis of all fleet equipment to determine most economically useful life.<br />
• Schedules and conducts "retirement" inspections, which support replacing equipment or extending its life.<br />
• Prepares specifications for equipment and participates in the procurement process.<br />
<strong>Budget</strong>ary Cost Summary<br />
FY 2009<br />
Actual<br />
FY 2010<br />
Actual<br />
FY 2011<br />
<strong>Adopted</strong><br />
FY 2011<br />
Amended<br />
FY 2011<br />
Estimated<br />
FY 2012<br />
<strong>Adopted</strong><br />
FY 2012<br />
Change<br />
Wages And Benefits 4,928,376 5,130,087 5,347,801 5,347,801 4,831,806 5,060,831 (5.37%)<br />
Services And Commodities 9,637,065 10,611,415 10,198,587 11,580,191 11,530,053 11,120,838 9.04%<br />
<strong>Capital</strong> 2,623,074 2,597,168 7,102,500 8,817,068 5,181,195 7,891,000 11.10%<br />
Transfers Out 333,996 0 0 0 0 0 0.00%<br />
Total <strong>Budget</strong> 17,522,512 18,338,671 22,648,888 25,745,059 21,543,054 24,072,669 6.29%<br />
Appropriations By Fund/Program<br />
FY 2009<br />
Actual<br />
FY 2010<br />
Actual<br />
FY 2011<br />
<strong>Adopted</strong><br />
FY 2011<br />
Amended<br />
FY 2011<br />
Estimated<br />
FY 2012<br />
<strong>Adopted</strong><br />
FY 2012<br />
Change<br />
General <strong>Operating</strong> Fund<br />
Finance Administration Program 116 0 0 0 0 0 0.00%<br />
Fleet Management<br />
Fleet Program 14,442,895 15,571,284 15,376,588 16,758,192 16,211,775 16,011,869 4.13%<br />
Equipment Replacement<br />
Equipment Replacement Program 3,079,501 2,767,185 7,272,300 8,986,868 5,331,279 8,060,800 10.84%<br />
Fleet Program 0 201 0 0 0 0 0.00%<br />
Totals for Equipment Replacement 3,079,501 2,767,386 7,272,300 8,986,868 5,331,279 8,060,800 10.84%<br />
Total <strong>Budget</strong> 17,522,512 18,338,671 22,648,888 25,745,059 21,543,054 24,072,669 6.29%<br />
Revenue Sources<br />
FY 2009<br />
Actual<br />
FY 2010<br />
Actual<br />
FY 2011<br />
<strong>Adopted</strong><br />
FY 2011<br />
Amended<br />
FY 2011<br />
Estimated<br />
FY 2012<br />
<strong>Adopted</strong><br />
FY 2012<br />
Change<br />
Federal Grants 140 0 0 241,195 396,569 0 0.00%<br />
Interest Earnings<br />
960,226 510,995 647,453 647,453 471,292 257,168<br />
(60.28%<br />
)<br />
Sale Of Fixed Assets 572,180 51,067 0 0 571,082 0 0.00%<br />
Sale Of Surplus Material 4,601 5,438 7,500 7,500 9,004 7,500 0.00%<br />
Contributions And Donations 0 25,002 0 0 0 0 0.00%<br />
Misc Revenue (257,718) 155 0 0 86 0 0.00%<br />
Department Charges 19,358,253 17,939,100 18,806,047 18,806,047 19,897,259 19,770,615 5.13%<br />
Other Charges (1) 0 0 0 0 0 0.00%<br />
Fleet Management (704,653) 431,092 (301,412) 838,997 (997,776) (299,772) (0.54%)<br />
Equipment Replacement (2,410,634) (624,180) 3,489,300 5,203,868 1,195,576 4,337,158 24.30%<br />
Health Insurance 0 0 0 0 (38) 0 0.00%<br />
General Fund 116 0 0 0 0 0 0.00%<br />
Fiscal Year 2012 K-8 Summary Reports