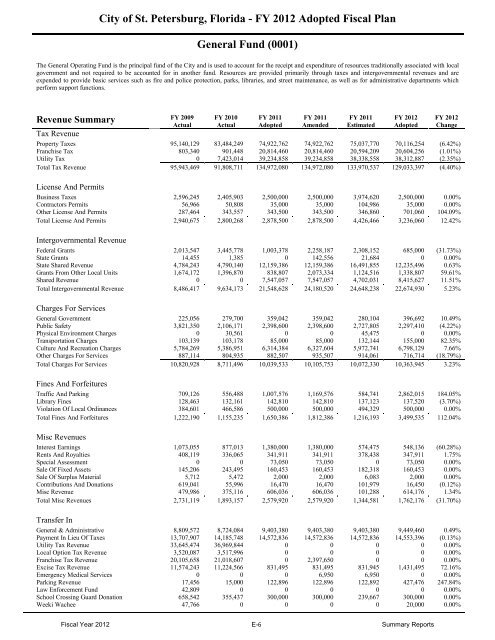
City of St. Petersburg, Florida - FY 2012 <strong>Adopted</strong> Fiscal Plan General Fund (0001) The General <strong>Operating</strong> Fund is the principal fund of the City and is used to account for the receipt and expenditure of resources traditionally associated with local government and not required to be accounted for in another fund. Resources are provided primarily through taxes and intergovernmental revenues and are expended to provide basic services such as fire and police protection, parks, libraries, and street maintenance, as well as for administrative departments which perform support functions. Revenue Summary FY 2009 Actual FY 2010 Actual FY 2011 <strong>Adopted</strong> FY 2011 Amended FY 2011 Estimated FY 2012 <strong>Adopted</strong> FY 2012 Change Tax Revenue Property Taxes 95,140,129 83,484,249 74,922,762 74,922,762 75,037,770 70,116,254 (6.42%) Franchise Tax 803,340 901,448 20,814,460 20,814,460 20,594,209 20,604,256 (1.01%) Utility Tax 0 7,423,014 39,234,858 39,234,858 38,338,558 38,312,887 (2.35%) Total Tax Revenue 95,943,469 91,808,711 134,972,080 134,972,080 133,970,537 129,033,397 (4.40%) License And Permits Business Taxes 2,596,245 2,405,903 2,500,000 2,500,000 3,974,620 2,500,000 0.00% Contractors Permits 56,966 50,808 35,000 35,000 104,986 35,000 0.00% Other License And Permits 287,464 343,557 343,500 343,500 346,860 701,060 104.09% Total License And Permits 2,940,675 2,800,268 2,878,500 2,878,500 4,426,466 3,236,060 12.42% Intergovernmental Revenue Federal Grants 2,013,547 3,445,778 1,003,378 2,258,187 2,308,152 685,000 (31.73%) State Grants 14,455 1,385 0 142,556 21,684 0 0.00% State Shared Revenue 4,784,243 4,790,140 12,159,386 12,159,386 16,491,855 12,235,496 0.63% Grants From Other Local Units 1,674,172 1,396,870 838,807 2,073,334 1,124,516 1,338,807 59.61% Shared Revenue 0 0 7,547,057 7,547,057 4,702,031 8,415,627 11.51% Total Intergovernmental Revenue 8,486,417 9,634,173 21,548,628 24,180,520 24,648,238 22,674,930 5.23% Charges For Services General Government 225,056 279,700 359,042 359,042 280,104 396,692 10.49% Public Safety 3,821,350 2,106,171 2,398,600 2,398,600 2,727,805 2,297,410 (4.22%) Physical Environment Charges 0 30,561 0 0 45,475 0 0.00% Transportation Charges 103,139 103,178 85,000 85,000 132,144 155,000 82.35% Culture And Recreation Charges 5,784,269 5,386,951 6,314,384 6,327,604 5,972,741 6,798,129 7.66% Other Charges For Services 887,114 804,935 882,507 935,507 914,061 716,714 (18.79%) Total Charges For Services 10,820,928 8,711,496 10,039,533 10,105,753 10,072,330 10,363,945 3.23% Fines And Forfeitures Traffic And Parking 709,126 556,488 1,007,576 1,169,576 584,741 2,862,015 184.05% Library Fines 128,463 132,161 142,810 142,810 137,123 137,520 (3.70%) Violation Of Local Ordinances 384,601 466,586 500,000 500,000 494,329 500,000 0.00% Total Fines And Forfeitures 1,222,190 1,155,235 1,650,386 1,812,386 1,216,193 3,499,535 112.04% Misc Revenues Interest Earnings 1,073,055 877,013 1,380,000 1,380,000 574,475 548,136 (60.28%) Rents And Royalties 408,119 336,065 341,911 341,911 378,438 347,911 1.75% Special Assessment 0 0 73,050 73,050 0 73,050 0.00% Sale Of Fixed Assets 145,206 243,495 160,453 160,453 182,318 160,453 0.00% Sale Of Surplus Material 5,712 5,472 2,000 2,000 6,083 2,000 0.00% Contributions And Donations 619,041 55,996 16,470 16,470 101,979 16,450 (0.12%) Misc Revenue 479,986 375,116 606,036 606,036 101,288 614,176 1.34% Total Misc Revenues 2,731,119 1,893,157 2,579,920 2,579,920 1,344,581 1,762,176 (31.70%) Transfer In General & Administrative 8,809,572 8,724,084 9,403,380 9,403,380 9,403,380 9,449,460 0.49% Payment In Lieu Of Taxes 13,707,907 14,185,748 14,572,836 14,572,836 14,572,836 14,553,396 (0.13%) Utility Tax Revenue 33,645,474 36,969,844 0 0 0 0 0.00% Local Option Tax Revenue 3,520,087 3,517,996 0 0 0 0 0.00% Franchise Tax Revenue 20,105,658 21,018,607 0 2,397,650 0 0 0.00% Excise Tax Revenue 11,574,243 11,224,566 831,495 831,495 831,945 1,431,495 72.16% Emergency Medical Services 0 0 0 6,950 6,950 0 0.00% Parking Revenue 17,456 15,000 122,896 122,896 122,892 427,476 247.84% Law Enforcement Fund 42,809 0 0 0 0 0 0.00% School Crossing Guard Donation 658,542 355,437 300,000 300,000 239,667 300,000 0.00% Weeki Wachee 47,766 0 0 0 0 20,000 0.00% Fiscal Year 2012 E-6 Summary Reports
City of St. Petersburg, Florida - FY 2012 <strong>Adopted</strong> Fiscal Plan Community Development Block Grant 0 0 272,615 272,615 272,615 498,148 82.73% Sanitation <strong>Operating</strong> 455,076 455,076 455,076 455,076 455,076 455,076 0.00% Airport <strong>Operating</strong> 0 0 50,000 50,000 50,004 50,000 0.00% Marina <strong>Operating</strong> 300,000 300,000 300,000 300,000 300,000 310,000 3.33% Jamestown Complex 0 0 35,000 35,000 35,004 35,000 0.00% Information & Communication Services 0 399,996 300,000 300,000 300,000 200,000 (33.33%) Total Transfer In 92,884,590 97,166,354 26,643,298 29,047,898 26,590,369 27,730,051 4.08% Internal Charges Department Charges 802 208 500 500 66 500 0.00% Other Charges 650 (523) 0 0 (2,601) 0 0.00% Total Internal Charges 1,452 (315) 500 500 (2,535) 500 0.00% Total Revenue Summary 215,030,840 213,169,079 200,312,845 205,577,557 202,266,179 198,300,594 (1.00%) Appropriations FY 2009 Actual FY 2010 Actual FY 2011 <strong>Adopted</strong> FY 2011 Amended FY 2011 Estimated FY 2012 <strong>Adopted</strong> FY 2012 Change Wages And Benefits 150,742,066 150,906,185 150,136,165 153,197,723 148,367,957 144,803,168 (3.55%) Services And Commodities 43,109,588 41,540,709 38,771,885 41,440,754 40,541,882 39,783,064 2.61% <strong>Capital</strong> 1,552,054 2,639,514 855,793 1,957,348 1,162,705 702,775 (17.88%) Grants And Aid 2,691,194 1,928,236 1,931,013 2,946,150 1,797,546 2,657,450 37.62% Contingencies 0 0 362,953 262,953 0 791,078 117.96% Transfers Out Economic Stability 6,000,000 0 0 0 0 0 0.00% Arts And Cultural Programs 99,996 0 0 0 0 0 0.00% Bayboro Harbor Tax Increment District 0 0 52,329 52,329 37,597 21,004 (59.86%) Intown West Tax Increment District 0 0 178,923 178,923 171,636 118,361 (33.85%) Neighborhood Stabilization Program 0 0 0 360,000 360,000 0 0.00% Mahaffey Theater <strong>Operating</strong> 934,000 965,700 774,000 1,016,000 1,042,000 670,000 (13.44%) Pier <strong>Operating</strong> 1,509,000 1,427,000 1,246,000 1,246,000 1,207,000 1,399,000 12.28% Coliseum <strong>Operating</strong> 193,000 232,000 176,000 237,000 220,000 201,000 14.20% Sunken Gardens 230,000 222,000 166,000 211,000 202,000 202,000 21.69% Tropicana Field 1,566,000 1,102,000 1,365,335 1,480,335 1,434,000 1,250,000 (8.45%) Community Redevelopment District 5,480,435 4,856,894 4,396,973 4,396,973 4,374,560 4,366,735 (0.69%) FFGFC Loan 1,118,922 2,625,421 2,628,006 2,628,006 2,628,465 2,635,316 0.28% General <strong>Capital</strong> <strong>Improvement</strong>s 640,635 364,290 0 832,640 832,640 0 0.00% Airport <strong>Operating</strong> 466,000 136,000 0 0 0 0 0.00% Jamestown Complex 0 70,000 0 0 0 0 0.00% Port <strong>Operating</strong> 469,000 508,000 487,000 487,000 397,000 271,000 (44.35%) Total Transfers Out 18,706,988 12,509,305 11,470,566 13,126,206 12,906,898 11,134,416 (2.93%) Total Appropriations 216,801,890 209,523,949 203,528,375 212,931,134 204,776,988 199,871,951 (1.80%) Increase/(Decrease) in Fund Balance (1,771,050) 3,645,130 (3,215,530) (7,353,577) (2,510,809) (1,571,357) Beginning Balance 26,390,780 24,743,276 27,358,621 27,358,621 27,358,621 25,726,729 Adjustments 123,546 (1,029,785) 0 878,917 878,917 0 Ending Balance 24,743,276 27,358,621 24,143,091 20,883,961 25,726,729 24,155,372 Each year City Council has committed a portion of the General <strong>Operating</strong> Fund balance that exceeds the target balance for specific purposes. $6.888 million was designated at the end of both FY09 and FY10. The FY11 committment amounts will be established after the final adjustments are made. For <strong>FY12</strong>, funds designated from prior year savings will be used to balance the budget. The City's fiscal policies call for a General Fund <strong>Operating</strong> Reserve target equal to 20% of the current year appropriations, with the fund balance of the Economic Stability Fund included. As of the end of FY11, the target fund balance is projected to be at the target. Fiscal Year 2012 E-7 Summary Reports
- Page 1 and 2:
CITY OF ST. PETERSBURG FLORIDA Adop
- Page 3 and 4:
CITY OF ST. PETERSBURG OPERATING BU
- Page 5 and 6:
USING THIS ONLINE VERSION: THROUGHO
- Page 7 and 8:
City of St. Petersburg, Florida- FY
- Page 9 and 10:
City of St. Petersburg, Florida- FY
- Page 11 and 12:
Section A EXECUTIVE SUMMARY
- Page 13 and 14:
City of St. Petersburg, Florida - F
- Page 15 and 16:
City of St. Petersburg, Florida - F
- Page 17 and 18:
City of St. Petersburg, Florida - F
- Page 19 and 20:
City of St. Petersburg, Florida - F
- Page 21 and 22:
City of St. Petersburg, Florida - F
- Page 23 and 24:
City of St. Petersburg, Florida - F
- Page 25 and 26:
City of St. Petersburg, Florida - F
- Page 27 and 28:
City of St. Petersburg, Florida - F
- Page 29 and 30:
City of St. Petersburg, Florida - F
- Page 31 and 32:
City of St. Petersburg, Florida - F
- Page 33 and 34:
City of St. Petersburg, Florida - F
- Page 35 and 36:
City of St. Petersburg, Florida - F
- Page 37 and 38:
City of St. Petersburg, Florida - F
- Page 39 and 40:
City of St. Petersburg, Florida - F
- Page 41 and 42:
City of St. Petersburg, Florida - F
- Page 43 and 44: City of St. Petersburg, Florida - F
- Page 45 and 46: City of St. Petersburg, Florida - F
- Page 47 and 48: City of St. Petersburg, Florida - F
- Page 49 and 50: City of St. Petersburg, Florida - F
- Page 51 and 52: City of St. Petersburg, Florida - F
- Page 53 and 54: City of St. Petersburg, Florida - F
- Page 55 and 56: Section B FISCAL POLICIES
- Page 57 and 58: City of St. Petersburg, Florida - F
- Page 59 and 60: City of St. Petersburg, Florida - F
- Page 61 and 62: City of St. Petersburg, Florida - F
- Page 63 and 64: City of St. Petersburg, Florida - F
- Page 65 and 66: City of St. Petersburg, Florida - F
- Page 67 and 68: City of St. Petersburg, Florida - F
- Page 69 and 70: City of St. Petersburg, Florida - F
- Page 71 and 72: City of St. Petersburg, Florida - F
- Page 73 and 74: City of St. Petersburg, Florida - F
- Page 75 and 76: City of St. Petersburg, Florida - F
- Page 77 and 78: Section D REVENUE HIGHLIGHTS
- Page 79 and 80: City of St. Petersburg, Florida - F
- Page 81 and 82: Utility Taxes: City of St. Petersbu
- Page 83 and 84: City of St. Petersburg, Florida - F
- Page 85 and 86: City of St. Petersburg, Florida - F
- Page 87 and 88: City of St. Petersburg, Florida - F
- Page 89 and 90: City of St. Petersburg, Florida - F
- Page 91 and 92: City of St. Petersburg, Florida - F
- Page 93: City of St. Petersburg, Florida - F
- Page 97 and 98: City of St. Petersburg, Florida - F
- Page 99 and 100: City of St. Petersburg, Florida - F
- Page 101 and 102: City of St. Petersburg, Florida - F
- Page 103 and 104: City of St. Petersburg, Florida - F
- Page 105 and 106: City of St. Petersburg, Florida - F
- Page 107 and 108: City of St. Petersburg, Florida - F
- Page 109 and 110: City of St. Petersburg, Florida - F
- Page 111 and 112: City of St. Petersburg, Florida - F
- Page 113 and 114: City of St. Petersburg, Florida - F
- Page 115 and 116: City of St. Petersburg, Florida - F
- Page 117 and 118: City of St. Petersburg, Florida - F
- Page 119 and 120: City of St. Petersburg, Florida - F
- Page 121 and 122: City of St. Petersburg, Florida - F
- Page 123 and 124: City of St. Petersburg, Florida - F
- Page 125 and 126: City of St. Petersburg, Florida - F
- Page 127 and 128: City of St. Petersburg, Florida - F
- Page 129 and 130: City of St. Petersburg, Florida - F
- Page 131 and 132: City of St. Petersburg, Florida - F
- Page 133 and 134: City of St. Petersburg, Florida - F
- Page 135 and 136: City of St. Petersburg, Florida - F
- Page 137 and 138: City of St. Petersburg, Florida - F
- Page 139 and 140: City of St. Petersburg, Florida - F
- Page 141 and 142: City of St. Petersburg, Florida - F
- Page 143 and 144: City of St. Petersburg, Florida - F
- Page 145 and 146:
City of St. Petersburg, Florida - F
- Page 147 and 148:
City of St. Petersburg, Florida - F
- Page 149 and 150:
City of St. Petersburg, Florida - F
- Page 151 and 152:
City of St. Petersburg, Florida - F
- Page 153 and 154:
City of St. Petersburg, Florida - F
- Page 155 and 156:
City of St. Petersburg, Florida - F
- Page 157 and 158:
City of St. Petersburg, Florida - F
- Page 159 and 160:
City of St. Petersburg, Florida - F
- Page 161 and 162:
City of St. Petersburg, Florida - F
- Page 163 and 164:
City of St. Petersburg, Florida - F
- Page 165 and 166:
City of St. Petersburg, Florida - F
- Page 167 and 168:
City of St. Petersburg, Florida - F
- Page 169 and 170:
Section F DEBT SERVICE
- Page 171 and 172:
City of St. Petersburg, Florida - F
- Page 173 and 174:
Section G CITY DEVELOPMENT
- Page 175 and 176:
City of St. Petersburg, Florida - F
- Page 177 and 178:
City of St. Petersburg, Florida - F
- Page 179 and 180:
City of St. Petersburg, Florida - F
- Page 181 and 182:
City of St. Petersburg, Florida - F
- Page 183 and 184:
City of St. Petersburg, Florida - F
- Page 185 and 186:
City of St. Petersburg, Florida - F
- Page 187 and 188:
City of St. Petersburg, Florida - F
- Page 189 and 190:
Department Mission Statement City o
- Page 191 and 192:
City of St. Petersburg, Florida - F
- Page 193 and 194:
Department Mission Statement City o
- Page 195 and 196:
Department Mission Statement City o
- Page 197 and 198:
Section H GENERAL GOVERNMENT
- Page 199 and 200:
City of St. Petersburg, Florida - F
- Page 201 and 202:
City of St. Petersburg, Florida - F
- Page 203 and 204:
City of St. Petersburg, Florida - F
- Page 205 and 206:
Department Mission Statement City o
- Page 207 and 208:
Department Mission Statement City o
- Page 209 and 210:
Department Mission Statement City o
- Page 211 and 212:
Department Mission Statement City o
- Page 213 and 214:
City of St. Petersburg, Florida - F
- Page 215 and 216:
City of St. Petersburg, Florida - F
- Page 217 and 218:
City of St. Petersburg, Florida - F
- Page 219 and 220:
City of St. Petersburg, Florida - F
- Page 221 and 222:
City of St. Petersburg, Florida - F
- Page 223 and 224:
City of St. Petersburg, Florida - F
- Page 225 and 226:
City of St. Petersburg, Florida - F
- Page 227 and 228:
City of St. Petersburg, Florida - F
- Page 229 and 230:
City of St. Petersburg, Florida - F
- Page 231 and 232:
City of St. Petersburg, Florida - F
- Page 233 and 234:
City of St. Petersburg, Florida - F
- Page 235 and 236:
City of St. Petersburg, Florida - F
- Page 237 and 238:
City of St. Petersburg, Florida - F
- Page 239 and 240:
City of St. Petersburg, Florida - F
- Page 241 and 242:
City of St. Petersburg, Florida - F
- Page 243 and 244:
City of St. Petersburg, Florida - F
- Page 245 and 246:
City of St. Petersburg, Florida - F
- Page 247 and 248:
City of St. Petersburg, Florida - F
- Page 249 and 250:
City of St. Petersburg, Florida - F
- Page 251 and 252:
City of St. Petersburg, Florida - F
- Page 253 and 254:
Section J PUBLIC SAFETY
- Page 255 and 256:
City of St. Petersburg, Florida - F
- Page 257 and 258:
City of St. Petersburg, Florida - F
- Page 259 and 260:
City of St. Petersburg, Florida - F
- Page 261 and 262:
City of St. Petersburg, Florida - F
- Page 263 and 264:
City of St. Petersburg, Florida - F
- Page 265 and 266:
Section K PUBLIC WORKS
- Page 267 and 268:
City of St. Petersburg, Florida - F
- Page 269 and 270:
City of St. Petersburg, Florida - F
- Page 271 and 272:
City of St. Petersburg, Florida - F
- Page 273 and 274:
Department Mission Statement City o
- Page 275 and 276:
Department Mission Statement City o
- Page 277 and 278:
City of St. Petersburg, Florida - F
- Page 279 and 280:
Department Mission Statement City o
- Page 281 and 282:
Objective and Performance Measure C
- Page 283 and 284:
City of St. Petersburg, Florida - F
- Page 285 and 286:
City of St. Petersburg, Florida - F
- Page 287 and 288:
City of St. Petersburg, Florida - F
- Page 289 and 290:
Section L Capital Improvement Progr
- Page 291 and 292:
City of St. Petersburg, Florida - F
- Page 293 and 294:
Section M Capital Improvement Progr
- Page 295 and 296:
City of St. Petersburg, Florida - F
- Page 297 and 298:
City of St. Petersburg, Florida - F
- Page 299 and 300:
City of St. Petersburg, Florida - F
- Page 301 and 302:
City of St. Petersburg, Florida - F
- Page 303 and 304:
City of St. Petersburg, Florida - F
- Page 305 and 306:
City of St. Petersburg, Florida - F
- Page 307 and 308:
City of St. Petersburg, Florida - F
- Page 309 and 310:
City of St. Petersburg, Florida - F
- Page 311 and 312:
City of St. Petersburg, Florida - F
- Page 313 and 314:
City of St. Petersburg, Florida - F
- Page 315 and 316:
City of St. Petersburg, Florida - F
- Page 317 and 318:
City of St. Petersburg, Florida - F
- Page 319 and 320:
City of St. Petersburg, Florida - F
- Page 321 and 322:
Project Descriptions City of St. Pe
- Page 323 and 324:
City of St. Petersburg, Florida - F
- Page 325 and 326:
City of St. Petersburg, Florida - F
- Page 327 and 328:
City of St. Petersburg, Florida - F
- Page 329 and 330:
City of St. Petersburg, Florida - F
- Page 331 and 332:
City of St. Petersburg, Florida - F
- Page 333 and 334:
City of St. Petersburg, Florida - F
- Page 335 and 336:
City of St. Petersburg, Florida - F
- Page 337 and 338:
City of St. Petersburg, Florida - F
- Page 339 and 340:
City of St. Petersburg, Florida - F
- Page 341 and 342:
City of St. Petersburg, Florida - F
- Page 343 and 344:
City of St. Petersburg, Florida - F
- Page 345 and 346:
City of St. Petersburg, Florida - F
- Page 347 and 348:
City of St. Petersburg, Florida - F
- Page 349 and 350:
City of St. Petersburg, Florida - F
- Page 351 and 352:
City of St. Petersburg, Florida - F
- Page 353 and 354:
Section Q Capital Improvement Progr
- Page 355 and 356:
City of St. Petersburg, Florida - F
- Page 357 and 358:
City of St. Petersburg, Florida - F
- Page 359 and 360:
City of St. Petersburg, Florida - F
- Page 361:
APPENDICES
- Page 371 and 372:
City of St. Petersburg, Florida - F
- Page 373 and 374:
City of St. Petersburg, Florida - F
- Page 375 and 376:
City of St. Petersburg, Florida - F
- Page 377 and 378:
City of St. Petersburg, Florida- FY
- Page 379:
Look At What We Can Accomplish! ST.