City of St. Petersburg, Florida - FY 2012 <strong>Adopted</strong> Fiscal Plan Fund Balance Summary Fund Beginning Balance Total Revenues Total Appropriations Change in Balance Ending Balance 0001 General Fund 25,726,729 198,300,594 199,871,951 (1,571,357) 24,155,372 0002 Preservation Reserve 912,230 0 0 0 912,230 0008 Economic Stability 21,411,359 198,600 0 198,600 21,609,959 0051 Health Facilities Authority 50,322 14,000 14,000 0 50,322 1003 Local Option Tax Revenue 33 0 0 0 33 1005 Franchise Tax Revenue 2,896,856 0 0 0 2,896,856 1007 Excise Tax Revenue 1,642,460 0 1,431,495 (1,431,495) 210,965 1009 Emergency Medical Services 3,395,415 12,478,188 13,072,940 (594,752) 2,800,663 1017 American Recovery & Reinvestment Act 111,477 0 0 0 111,477 1019 Local Housing Assistance 2,782,222 500,000 500,000 0 2,782,222 1021 Parking Revenue 1,243,245 5,250,167 4,809,413 440,754 1,683,999 1023 Law Enforcement Fund 1,513,687 0 186,335 (186,335) 1,327,352 1025 School Crossing Guard Donation 42,589 300,000 300,000 0 42,589 1041 Weeki Wachee 16,533,703 119,160 100,000 19,160 16,552,863 1042 Arts And Cultural Programs 100,177 0 0 0 100,177 1051 Pro Sports Facility 13,836 2,003,972 2,000,004 3,968 17,804 1105 Downtown Redevelopment District 1,885,694 6,703,500 8,169,124 (1,465,624) 420,070 1106 Bayboro Harbor Tax Increment District 220,385 38,316 0 38,316 258,701 1107 Intown West Tax Increment District 815,733 215,912 0 215,912 1,031,645 1108 Assessments Revenue 64,613 155,888 98,131 57,757 122,370 1111 Community Development Block Grant 2,436,626 2,092,593 2,092,593 0 2,436,626 1112 Emergency Shelter Grant Fund 61,763 97,039 97,039 0 61,763 1113 Home Program 1,923,697 1,429,023 1,429,023 0 1,923,697 1114 Neighborhood Stabilization Program 704,809 0 0 0 704,809 1115 Miscellaneous Trust Funds 0 1,500,000 1,500,000 0 0 1117 Community Housing Donation 1,053,160 0 0 0 1,053,160 1151 Building Permit Special Revenue 624,646 3,051,000 3,485,604 (434,604) 190,042 1201 Mahaffey Theater <strong>Operating</strong> 4,429 3,528,544 3,532,399 (3,855) 574 1203 Pier <strong>Operating</strong> 10,033 2,372,708 2,373,869 (1,161) 8,872 1205 Coliseum <strong>Operating</strong> (1,452) 751,390 749,239 2,151 699 1207 Sunken Gardens 6,933 874,407 874,148 259 7,192 1208 Tropicana Field 36,035 2,385,641 2,421,227 (35,586) 449 1301 Community Redevelopment District 1,270,738 7,973,681 6,703,500 1,270,181 2,540,919 1702 Police Grant Fund 670,230 0 548,042 (548,042) 122,188 2011 FFGFC Loan 6,654 2,706,550 2,706,550 0 6,654 2013 Banc Of America Notes Debt Service Fund 469,817 1,106,011 1,181,512 (75,501) 394,316 2014 BB&T Notes 292 642,396 642,396 0 292 2025 Stadium Debt Service 7,405,673 8,792,880 8,620,019 172,861 7,578,534 2027 Sports Facility Sales Tax Debt 1,481,744 1,929,525 1,911,587 17,938 1,499,682 2035 Redevelopment Debt Service 0 6,703,500 6,703,500 0 0 4001 Water Resources 21,901,337 102,107,669 103,073,535 (965,866) 20,935,471 4002 Water Resources Debt 20,152,461 18,470,113 18,046,144 423,969 20,576,430 4005 Water Cost Stabilization 83,656,023 1,500,000 1,500,000 0 83,656,023 4011 Stormwater Utility <strong>Operating</strong> 5,950,904 12,049,717 10,485,901 1,563,816 7,514,720 4012 Stormwater Debt Service 599,764 1,058,332 1,053,332 5,000 604,764 4021 Sanitation <strong>Operating</strong> 14,564,368 40,113,876 38,536,558 1,577,318 16,141,686 4027 Sanitation Equipment Replacement 4,946,198 2,029,790 2,244,000 (214,210) 4,731,988 4031 Airport <strong>Operating</strong> 123,608 993,100 959,181 33,919 157,527 4041 Marina <strong>Operating</strong> 139,177 3,225,595 3,225,402 193 139,370 4061 Golf Course <strong>Operating</strong> 214,424 3,757,986 3,759,127 (1,141) 213,283 4081 Jamestown Complex 142,416 509,132 556,754 (47,622) 94,794 4091 Port <strong>Operating</strong> 2,281 454,526 454,219 307 2,588 5001 Fleet Management 2,503,635 16,311,641 16,011,869 299,772 2,803,407 5002 Equipment Replacement 22,108,842 3,723,642 8,060,800 (4,337,158) 17,771,684 5005 Municipal Office Buildings 1,700,831 2,693,797 2,406,152 287,645 1,988,476 5011 Information & Communication Services 1,942,893 9,629,622 10,190,139 (560,517) 1,382,376 5015 PC Replacement 198,107 0 0 0 198,107 5017 Radio Replacement 16,050 0 0 0 16,050 5019 Technology & Infrastructure Fund 8,224,428 777,796 780,090 (2,294) 8,222,134 5031 Supply Management 121,195 525,000 522,665 2,335 123,530 5121 Health Insurance 20,694,134 32,651,159 34,019,506 (1,368,347) 19,325,787 5123 Life Insurance 204,146 747,572 946,496 (198,924) 5,222 5125 General Liabilities Claims 4,265,556 2,250,035 2,265,672 (15,637) 4,249,919 5127 Commercial Insurance 3,038,521 4,879,463 4,881,431 (1,968) 3,036,553 5129 Workers' Compensation 16,394,770 7,058,091 7,247,940 (189,849) 16,204,921 5201 Billing & Collections 1,806,061 8,359,449 8,380,587 (21,138) 1,784,923 Totals 335,140,722 550,092,288 557,733,140 (7,640,852) 327,499,870 Fiscal Year 2012 E-2 Summary Reports
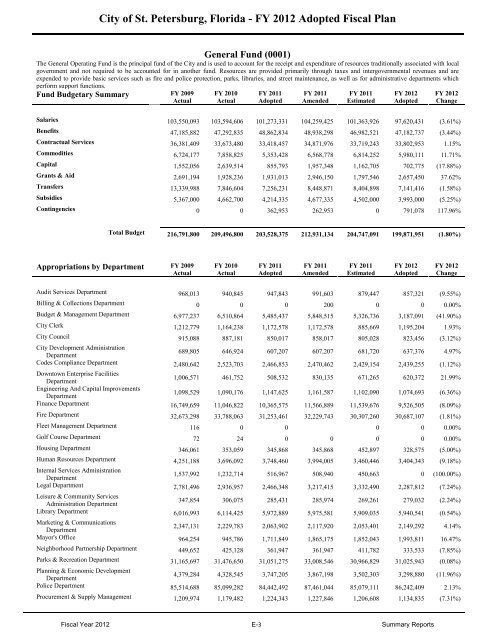
City of St. Petersburg, Florida - FY 2012 <strong>Adopted</strong> Fiscal Plan General Fund (0001) The General <strong>Operating</strong> Fund is the principal fund of the City and is used to account for the receipt and expenditure of resources traditionally associated with local government and not required to be accounted for in another fund. Resources are provided primarily through taxes and intergovernmental revenues and are expended to provide basic services such as fire and police protection, parks, libraries, and street maintenance, as well as for administrative departments which perform support functions. Fund <strong>Budget</strong>ary Summary FY 2009 Actual FY 2010 Actual FY 2011 <strong>Adopted</strong> FY 2011 Amended FY 2011 Estimated FY 2012 <strong>Adopted</strong> FY 2012 Change Salaries 103,550,093 103,594,606 101,273,331 104,259,425 101,363,926 97,620,431 (3.61%) Benefits 47,185,882 47,292,835 48,862,834 48,938,298 46,982,521 47,182,737 (3.44%) Contractual Services 36,381,409 33,673,480 33,418,457 34,871,976 33,719,243 33,802,953 1.15% Commodities 6,724,177 7,858,825 5,353,428 6,568,778 6,814,252 5,980,111 11.71% <strong>Capital</strong> 1,552,056 2,639,514 855,793 1,957,348 1,162,705 702,775 (17.88%) Grants & Aid 2,691,194 1,928,236 1,931,013 2,946,150 1,797,546 2,657,450 37.62% Transfers 13,339,988 7,846,604 7,256,231 8,448,871 8,404,898 7,141,416 (1.58%) Subsidies 5,367,000 4,662,700 4,214,335 4,677,335 4,502,000 3,993,000 (5.25%) Contingencies 0 0 362,953 262,953 0 791,078 117.96% Total <strong>Budget</strong> 216,791,800 209,496,800 203,528,375 212,931,134 204,747,091 199,871,951 (1.80%) Appropriations by Department FY 2009 Actual FY 2010 Actual FY 2011 <strong>Adopted</strong> FY 2011 Amended FY 2011 Estimated FY 2012 <strong>Adopted</strong> FY 2012 Change Audit Services Department 968,013 940,845 947,843 991,603 879,447 857,321 (9.55%) Billing & Collections Department 0 0 0 200 0 0 0.00% <strong>Budget</strong> & Management Department 6,977,237 6,510,864 5,485,437 5,848,515 5,326,736 3,187,091 (41.90%) City Clerk 1,212,779 1,164,238 1,172,578 1,172,578 885,669 1,195,204 1.93% City Council 915,088 887,181 850,017 858,017 805,028 823,456 (3.12%) City Development Administration 689,805 646,924 607,207 607,207 681,720 637,376 4.97% Department Codes Compliance Department 2,480,642 2,523,703 2,466,853 2,470,462 2,429,154 2,439,255 (1.12%) Downtown Enterprise Facilities 1,006,571 461,752 508,532 830,135 671,265 620,372 21.99% Department Engineering And <strong>Capital</strong> <strong>Improvement</strong>s 1,098,529 1,090,176 1,147,625 1,161,587 1,102,090 1,074,693 (6.36%) Department Finance Department 16,749,659 11,046,822 10,365,575 11,566,889 11,539,676 9,526,505 (8.09%) Fire Department 32,673,298 33,788,063 31,253,461 32,229,743 30,307,260 30,687,107 (1.81%) Fleet Management Department 116 0 0 0 0 0.00% Golf Course Department 72 24 0 0 0 0 0.00% Housing Department 346,061 353,059 345,868 345,868 452,897 328,575 (5.00%) Human Resources Department 4,251,188 3,696,092 3,748,460 3,994,005 3,460,446 3,404,343 (9.18%) Internal Services Administration 1,537,992 1,232,714 516,967 508,940 450,663 0 (100.00%) Department Legal Department 2,781,496 2,936,957 2,466,348 3,217,415 3,332,490 2,287,812 (7.24%) Leisure & Community Services 347,854 306,075 285,431 285,974 269,261 279,032 (2.24%) Administration Department Library Department 6,016,993 6,114,425 5,972,889 5,975,581 5,909,035 5,940,541 (0.54%) Marketing & Communications 2,347,131 2,229,783 2,063,902 2,117,920 2,053,401 2,149,292 4.14% Department Mayor's Office 964,254 945,786 1,711,849 1,865,175 1,852,043 1,993,811 16.47% Neighborhood Partnership Department 449,652 425,128 361,947 361,947 411,782 333,533 (7.85%) Parks & Recreation Department 31,165,697 31,476,650 31,051,275 33,008,546 30,966,829 31,025,943 (0.08%) Planning & Economic Development 4,379,284 4,328,545 3,747,205 3,867,198 3,502,303 3,298,880 (11.96%) Department Police Department 85,514,688 85,099,282 84,442,492 87,461,044 85,079,111 86,242,409 2.13% Procurement & Supply Management 1,209,974 1,179,482 1,224,343 1,227,846 1,206,608 1,134,835 (7.31%) Fiscal Year 2012 E-3 Summary Reports
- Page 1 and 2:
CITY OF ST. PETERSBURG FLORIDA Adop
- Page 3 and 4:
CITY OF ST. PETERSBURG OPERATING BU
- Page 5 and 6:
USING THIS ONLINE VERSION: THROUGHO
- Page 7 and 8:
City of St. Petersburg, Florida- FY
- Page 9 and 10:
City of St. Petersburg, Florida- FY
- Page 11 and 12:
Section A EXECUTIVE SUMMARY
- Page 13 and 14:
City of St. Petersburg, Florida - F
- Page 15 and 16:
City of St. Petersburg, Florida - F
- Page 17 and 18:
City of St. Petersburg, Florida - F
- Page 19 and 20:
City of St. Petersburg, Florida - F
- Page 21 and 22:
City of St. Petersburg, Florida - F
- Page 23 and 24:
City of St. Petersburg, Florida - F
- Page 25 and 26:
City of St. Petersburg, Florida - F
- Page 27 and 28:
City of St. Petersburg, Florida - F
- Page 29 and 30:
City of St. Petersburg, Florida - F
- Page 31 and 32:
City of St. Petersburg, Florida - F
- Page 33 and 34:
City of St. Petersburg, Florida - F
- Page 35 and 36:
City of St. Petersburg, Florida - F
- Page 37 and 38:
City of St. Petersburg, Florida - F
- Page 39 and 40: City of St. Petersburg, Florida - F
- Page 41 and 42: City of St. Petersburg, Florida - F
- Page 43 and 44: City of St. Petersburg, Florida - F
- Page 45 and 46: City of St. Petersburg, Florida - F
- Page 47 and 48: City of St. Petersburg, Florida - F
- Page 49 and 50: City of St. Petersburg, Florida - F
- Page 51 and 52: City of St. Petersburg, Florida - F
- Page 53 and 54: City of St. Petersburg, Florida - F
- Page 55 and 56: Section B FISCAL POLICIES
- Page 57 and 58: City of St. Petersburg, Florida - F
- Page 59 and 60: City of St. Petersburg, Florida - F
- Page 61 and 62: City of St. Petersburg, Florida - F
- Page 63 and 64: City of St. Petersburg, Florida - F
- Page 65 and 66: City of St. Petersburg, Florida - F
- Page 67 and 68: City of St. Petersburg, Florida - F
- Page 69 and 70: City of St. Petersburg, Florida - F
- Page 71 and 72: City of St. Petersburg, Florida - F
- Page 73 and 74: City of St. Petersburg, Florida - F
- Page 75 and 76: City of St. Petersburg, Florida - F
- Page 77 and 78: Section D REVENUE HIGHLIGHTS
- Page 79 and 80: City of St. Petersburg, Florida - F
- Page 81 and 82: Utility Taxes: City of St. Petersbu
- Page 83 and 84: City of St. Petersburg, Florida - F
- Page 85 and 86: City of St. Petersburg, Florida - F
- Page 87 and 88: City of St. Petersburg, Florida - F
- Page 89: City of St. Petersburg, Florida - F
- Page 93 and 94: City of St. Petersburg, Florida - F
- Page 95 and 96: City of St. Petersburg, Florida - F
- Page 97 and 98: City of St. Petersburg, Florida - F
- Page 99 and 100: City of St. Petersburg, Florida - F
- Page 101 and 102: City of St. Petersburg, Florida - F
- Page 103 and 104: City of St. Petersburg, Florida - F
- Page 105 and 106: City of St. Petersburg, Florida - F
- Page 107 and 108: City of St. Petersburg, Florida - F
- Page 109 and 110: City of St. Petersburg, Florida - F
- Page 111 and 112: City of St. Petersburg, Florida - F
- Page 113 and 114: City of St. Petersburg, Florida - F
- Page 115 and 116: City of St. Petersburg, Florida - F
- Page 117 and 118: City of St. Petersburg, Florida - F
- Page 119 and 120: City of St. Petersburg, Florida - F
- Page 121 and 122: City of St. Petersburg, Florida - F
- Page 123 and 124: City of St. Petersburg, Florida - F
- Page 125 and 126: City of St. Petersburg, Florida - F
- Page 127 and 128: City of St. Petersburg, Florida - F
- Page 129 and 130: City of St. Petersburg, Florida - F
- Page 131 and 132: City of St. Petersburg, Florida - F
- Page 133 and 134: City of St. Petersburg, Florida - F
- Page 135 and 136: City of St. Petersburg, Florida - F
- Page 137 and 138: City of St. Petersburg, Florida - F
- Page 139 and 140: City of St. Petersburg, Florida - F
- Page 141 and 142:
City of St. Petersburg, Florida - F
- Page 143 and 144:
City of St. Petersburg, Florida - F
- Page 145 and 146:
City of St. Petersburg, Florida - F
- Page 147 and 148:
City of St. Petersburg, Florida - F
- Page 149 and 150:
City of St. Petersburg, Florida - F
- Page 151 and 152:
City of St. Petersburg, Florida - F
- Page 153 and 154:
City of St. Petersburg, Florida - F
- Page 155 and 156:
City of St. Petersburg, Florida - F
- Page 157 and 158:
City of St. Petersburg, Florida - F
- Page 159 and 160:
City of St. Petersburg, Florida - F
- Page 161 and 162:
City of St. Petersburg, Florida - F
- Page 163 and 164:
City of St. Petersburg, Florida - F
- Page 165 and 166:
City of St. Petersburg, Florida - F
- Page 167 and 168:
City of St. Petersburg, Florida - F
- Page 169 and 170:
Section F DEBT SERVICE
- Page 171 and 172:
City of St. Petersburg, Florida - F
- Page 173 and 174:
Section G CITY DEVELOPMENT
- Page 175 and 176:
City of St. Petersburg, Florida - F
- Page 177 and 178:
City of St. Petersburg, Florida - F
- Page 179 and 180:
City of St. Petersburg, Florida - F
- Page 181 and 182:
City of St. Petersburg, Florida - F
- Page 183 and 184:
City of St. Petersburg, Florida - F
- Page 185 and 186:
City of St. Petersburg, Florida - F
- Page 187 and 188:
City of St. Petersburg, Florida - F
- Page 189 and 190:
Department Mission Statement City o
- Page 191 and 192:
City of St. Petersburg, Florida - F
- Page 193 and 194:
Department Mission Statement City o
- Page 195 and 196:
Department Mission Statement City o
- Page 197 and 198:
Section H GENERAL GOVERNMENT
- Page 199 and 200:
City of St. Petersburg, Florida - F
- Page 201 and 202:
City of St. Petersburg, Florida - F
- Page 203 and 204:
City of St. Petersburg, Florida - F
- Page 205 and 206:
Department Mission Statement City o
- Page 207 and 208:
Department Mission Statement City o
- Page 209 and 210:
Department Mission Statement City o
- Page 211 and 212:
Department Mission Statement City o
- Page 213 and 214:
City of St. Petersburg, Florida - F
- Page 215 and 216:
City of St. Petersburg, Florida - F
- Page 217 and 218:
City of St. Petersburg, Florida - F
- Page 219 and 220:
City of St. Petersburg, Florida - F
- Page 221 and 222:
City of St. Petersburg, Florida - F
- Page 223 and 224:
City of St. Petersburg, Florida - F
- Page 225 and 226:
City of St. Petersburg, Florida - F
- Page 227 and 228:
City of St. Petersburg, Florida - F
- Page 229 and 230:
City of St. Petersburg, Florida - F
- Page 231 and 232:
City of St. Petersburg, Florida - F
- Page 233 and 234:
City of St. Petersburg, Florida - F
- Page 235 and 236:
City of St. Petersburg, Florida - F
- Page 237 and 238:
City of St. Petersburg, Florida - F
- Page 239 and 240:
City of St. Petersburg, Florida - F
- Page 241 and 242:
City of St. Petersburg, Florida - F
- Page 243 and 244:
City of St. Petersburg, Florida - F
- Page 245 and 246:
City of St. Petersburg, Florida - F
- Page 247 and 248:
City of St. Petersburg, Florida - F
- Page 249 and 250:
City of St. Petersburg, Florida - F
- Page 251 and 252:
City of St. Petersburg, Florida - F
- Page 253 and 254:
Section J PUBLIC SAFETY
- Page 255 and 256:
City of St. Petersburg, Florida - F
- Page 257 and 258:
City of St. Petersburg, Florida - F
- Page 259 and 260:
City of St. Petersburg, Florida - F
- Page 261 and 262:
City of St. Petersburg, Florida - F
- Page 263 and 264:
City of St. Petersburg, Florida - F
- Page 265 and 266:
Section K PUBLIC WORKS
- Page 267 and 268:
City of St. Petersburg, Florida - F
- Page 269 and 270:
City of St. Petersburg, Florida - F
- Page 271 and 272:
City of St. Petersburg, Florida - F
- Page 273 and 274:
Department Mission Statement City o
- Page 275 and 276:
Department Mission Statement City o
- Page 277 and 278:
City of St. Petersburg, Florida - F
- Page 279 and 280:
Department Mission Statement City o
- Page 281 and 282:
Objective and Performance Measure C
- Page 283 and 284:
City of St. Petersburg, Florida - F
- Page 285 and 286:
City of St. Petersburg, Florida - F
- Page 287 and 288:
City of St. Petersburg, Florida - F
- Page 289 and 290:
Section L Capital Improvement Progr
- Page 291 and 292:
City of St. Petersburg, Florida - F
- Page 293 and 294:
Section M Capital Improvement Progr
- Page 295 and 296:
City of St. Petersburg, Florida - F
- Page 297 and 298:
City of St. Petersburg, Florida - F
- Page 299 and 300:
City of St. Petersburg, Florida - F
- Page 301 and 302:
City of St. Petersburg, Florida - F
- Page 303 and 304:
City of St. Petersburg, Florida - F
- Page 305 and 306:
City of St. Petersburg, Florida - F
- Page 307 and 308:
City of St. Petersburg, Florida - F
- Page 309 and 310:
City of St. Petersburg, Florida - F
- Page 311 and 312:
City of St. Petersburg, Florida - F
- Page 313 and 314:
City of St. Petersburg, Florida - F
- Page 315 and 316:
City of St. Petersburg, Florida - F
- Page 317 and 318:
City of St. Petersburg, Florida - F
- Page 319 and 320:
City of St. Petersburg, Florida - F
- Page 321 and 322:
Project Descriptions City of St. Pe
- Page 323 and 324:
City of St. Petersburg, Florida - F
- Page 325 and 326:
City of St. Petersburg, Florida - F
- Page 327 and 328:
City of St. Petersburg, Florida - F
- Page 329 and 330:
City of St. Petersburg, Florida - F
- Page 331 and 332:
City of St. Petersburg, Florida - F
- Page 333 and 334:
City of St. Petersburg, Florida - F
- Page 335 and 336:
City of St. Petersburg, Florida - F
- Page 337 and 338:
City of St. Petersburg, Florida - F
- Page 339 and 340:
City of St. Petersburg, Florida - F
- Page 341 and 342:
City of St. Petersburg, Florida - F
- Page 343 and 344:
City of St. Petersburg, Florida - F
- Page 345 and 346:
City of St. Petersburg, Florida - F
- Page 347 and 348:
City of St. Petersburg, Florida - F
- Page 349 and 350:
City of St. Petersburg, Florida - F
- Page 351 and 352:
City of St. Petersburg, Florida - F
- Page 353 and 354:
Section Q Capital Improvement Progr
- Page 355 and 356:
City of St. Petersburg, Florida - F
- Page 357 and 358:
City of St. Petersburg, Florida - F
- Page 359 and 360:
City of St. Petersburg, Florida - F
- Page 361:
APPENDICES
- Page 371 and 372:
City of St. Petersburg, Florida - F
- Page 373 and 374:
City of St. Petersburg, Florida - F
- Page 375 and 376:
City of St. Petersburg, Florida - F
- Page 377 and 378:
City of St. Petersburg, Florida- FY
- Page 379:
Look At What We Can Accomplish! ST.