FY12 Adopted Operating Budget & Capital Improvement Budget
FY12 Adopted Operating Budget & Capital Improvement Budget
FY12 Adopted Operating Budget & Capital Improvement Budget

Create successful ePaper yourself
Turn your PDF publications into a flip-book with our unique Google optimized e-Paper software.
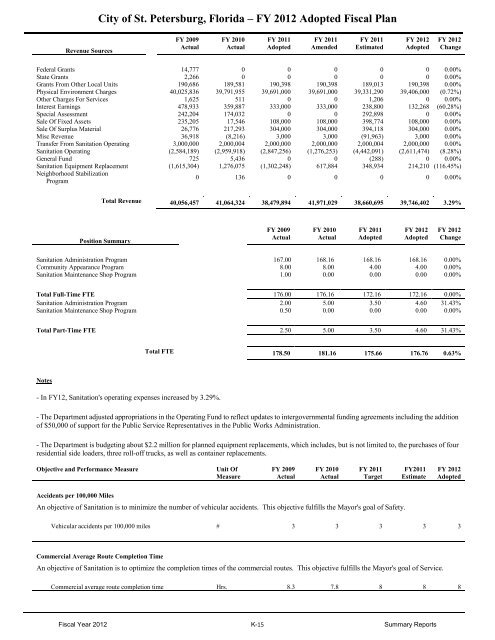
City of St. Petersburg, Florida – FY 2012 <strong>Adopted</strong> Fiscal Plan<br />
Revenue Sources<br />
FY 2009<br />
Actual<br />
FY 2010<br />
Actual<br />
FY 2011<br />
<strong>Adopted</strong><br />
FY 2011<br />
Amended<br />
FY 2011<br />
Estimated<br />
FY 2012<br />
<strong>Adopted</strong><br />
FY 2012<br />
Change<br />
Federal Grants 14,777 0 0 0 0 0 0.00%<br />
State Grants 2,266 0 0 0 0 0 0.00%<br />
Grants From Other Local Units 190,686 189,581 190,398 190,398 189,013 190,398 0.00%<br />
Physical Environment Charges 40,025,836 39,791,955 39,691,000 39,691,000 39,331,290 39,406,000 (0.72%)<br />
Other Charges For Services 1,625 511 0 0 1,206 0 0.00%<br />
Interest Earnings 478,933 359,887 333,000 333,000 238,800 132,268 (60.28%)<br />
Special Assessment 242,204 174,032 0 0 292,898 0 0.00%<br />
Sale Of Fixed Assets 235,205 17,546 108,000 108,000 398,774 108,000 0.00%<br />
Sale Of Surplus Material 26,776 217,293 304,000 304,000 394,118 304,000 0.00%<br />
Misc Revenue 36,918 (8,216) 3,000 3,000 (91,963) 3,000 0.00%<br />
Transfer From Sanitation <strong>Operating</strong> 3,000,000 2,000,004 2,000,000 2,000,000 2,000,004 2,000,000 0.00%<br />
Sanitation <strong>Operating</strong> (2,584,189) (2,959,918) (2,847,256) (1,276,253) (4,442,091) (2,611,474) (8.28%)<br />
General Fund 725 5,436 0 0 (288) 0 0.00%<br />
Sanitation Equipment Replacement (1,615,304) 1,276,075 (1,302,248) 617,884 348,934 214,210 (116.45%)<br />
Neighborhood Stabilization<br />
Program<br />
0 136 0 0 0 0 0.00%<br />
Total Revenue 40,056,457 41,064,324 38,479,894 41,971,029 38,660,695 39,746,402 3.29%<br />
Position Summary<br />
FY 2009<br />
Actual<br />
FY 2010<br />
Actual<br />
FY 2011<br />
<strong>Adopted</strong><br />
FY 2012<br />
<strong>Adopted</strong><br />
FY 2012<br />
Change<br />
Sanitation Administration Program 167.00 168.16 168.16 168.16 0.00%<br />
Community Appearance Program 8.00 8.00 4.00 4.00 0.00%<br />
Sanitation Maintenance Shop Program 1.00 0.00 0.00 0.00 0.00%<br />
Total Full-Time FTE 176.00 176.16 172.16 172.16 0.00%<br />
Sanitation Administration Program 2.00 5.00 3.50 4.60 31.43%<br />
Sanitation Maintenance Shop Program 0.50 0.00 0.00 0.00 0.00%<br />
Total Part-Time FTE 2.50 5.00 3.50 4.60 31.43%<br />
Total FTE 178.50 181.16 175.66 176.76 0.63%<br />
Notes<br />
- In <strong>FY12</strong>, Sanitation's operating expenses increased by 3.29%.<br />
- The Department adjusted appropriations in the <strong>Operating</strong> Fund to reflect updates to intergovernmental funding agreements including the addition<br />
of $50,000 of support for the Public Service Representatives in the Public Works Administration.<br />
- The Department is budgeting about $2.2 million for planned equipment replacements, which includes, but is not limited to, the purchases of four<br />
residential side loaders, three roll-off trucks, as well as container replacements.<br />
Objective and Performance Measure<br />
Unit Of<br />
Measure<br />
FY 2009<br />
Actual<br />
FY 2010<br />
Actual<br />
FY 2011<br />
Target<br />
FY2011<br />
Estimate<br />
FY 2012<br />
<strong>Adopted</strong><br />
Accidents per 100,000 Miles<br />
An objective of Sanitation is to minimize the number of vehicular accidents. This objective fulfills the Mayor's goal of Safety.<br />
Vehicular accidents per 100,000 miles # 3 3 3 3 3<br />
Commercial Average Route Completion Time<br />
An objective of Sanitation is to optimize the completion times of the commercial routes. This objective fulfills the Mayor's goal of Service.<br />
Commercial average route completion time Hrs. 8.3 7.8 8 8 8<br />
Fiscal Year 2012 K-15 Summary Reports