

IRR310313.pdf - Banco Itaú
IRR310313.pdf - Banco Itaú
IRR310313.pdf - Banco Itaú

You also want an ePaper? Increase the reach of your titles
YUMPU automatically turns print PDFs into web optimized ePapers that Google loves.
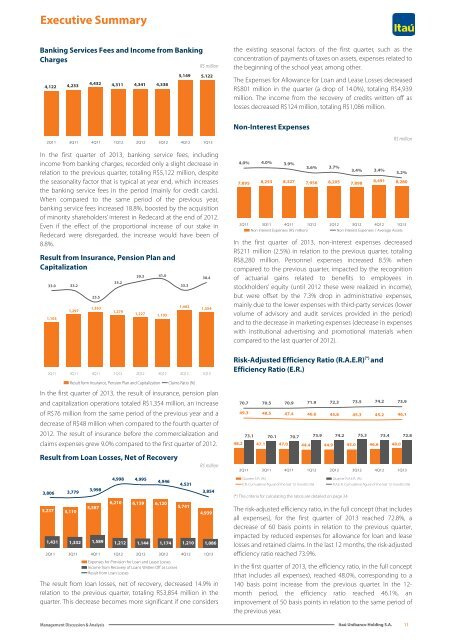
Executive Summary<br />
Banking Services Fees and Income from Banking<br />
Charges<br />
R$ million<br />
5,149 5,122<br />
4,432<br />
4,122 4,233<br />
4,311 4,341 4,338<br />
the existing seasonal factors of the first quarter, such as the<br />
concentration of payments of taxes on assets, expenses related to<br />
the beginning of the school year, among other.<br />
The Expenses for Allowance for Loan and Lease Losses decreased<br />
R$801 million in the quarter (a drop of 14.0%), totaling R$4,939<br />
million. The income from the recovery of credits written off as<br />
losses decreased R$124 million, totaling R$1,086 million.<br />
Non-Interest Expenses<br />
2Q11 3Q11 4Q11 1Q12 2Q12 3Q12 4Q12 1Q13<br />
In the first quarter of 2013, banking service fees, including<br />
income from banking charges, recorded only a slight decrease in<br />
relation to the previous quarter, totaling R$5,122 million, despite<br />
the seasonality factor that is typical at year end, which increases<br />
the banking service fees in the period (mainly for credit cards).<br />
When compared to the same period of the previous year,<br />
banking service fees increased 18.8%, boosted by the acquisition<br />
of minority shareholders’ interest in Redecard at the end of 2012.<br />
Even if the effect of the proportional increase of our stake in<br />
Redecard were disregarded, the increase would have been of<br />
8.8%.<br />
Result from Insurance, Pension Plan and<br />
Capitalization<br />
33.0 33.2<br />
1,105<br />
1,297<br />
25.5<br />
1,363<br />
35.2<br />
1,279<br />
39.3 41.0<br />
1,227 1,195<br />
33.3<br />
1,402<br />
38.4<br />
1,354<br />
4.0% 4.0% 3.9%<br />
3.6% 3.7%<br />
7,895 8,253 8,327 7,956 8,205 7,898<br />
3.4% 3.4%<br />
R$ million<br />
3.2%<br />
8,491 8,280<br />
2Q11 3Q11 4Q11 1Q12 2Q12 3Q12 4Q12 1Q13<br />
Non Interest Expenses (R$ million)<br />
Non Interest Expenses / Average Assets<br />
In the first quarter of 2013, non-interest expenses decreased<br />
R$211 million (2.5%) in relation to the previous quarter, totaling<br />
R$8,280 million. Personnel expenses increased 8.5% when<br />
compared to the previous quarter, impacted by the recognition<br />
of actuarial gains related to benefits to employees in<br />
stockholders’ equity (until 2012 these were realized in income),<br />
but were offset by the 7.3% drop in administrative expenses,<br />
mainly due to the lower expenses with third-party services (lower<br />
volume of advisory and audit services provided in the period)<br />
and to the decrease in marketing expenses (decrease in expenses<br />
with institutional advertising and promotional materials when<br />
compared to the last quarter of 2012).<br />
2Q11 3Q11 4Q11 1Q12 2Q12 3Q12 4Q12 1Q13<br />
Result form Insurance, Pension Plan and Capitalization Claims Ratio (%)<br />
In the first quarter of 2013, the result of insurance, pension plan<br />
and capitalization operations totaled R$1,354 million, an increase<br />
of R$76 million from the same period of the previous year and a<br />
decrease of R$48 million when compared to the fourth quarter of<br />
2012. The result of insurance before the commercialization and<br />
claims expenses grew 9.0% compared to the first quarter of 2012.<br />
Result from Loan Losses, Net of Recovery<br />
3,806<br />
5,237 5,110<br />
1,431<br />
3,779<br />
3,998<br />
5,587<br />
4,998 4,995<br />
4,946<br />
6,210 6,139 6,120<br />
4,531<br />
5,741<br />
3,854<br />
4,939<br />
1,332 1,589 1,212 1,144 1,174 1,210 1,086<br />
2Q11 3Q11 4Q11 1Q12 2Q12 3Q12 4Q12 1Q13<br />
Expenses for Provision for Loan and Lease Losses<br />
Income from Recovery of Loans Written Off as Losses<br />
Result from Loan Losses<br />
R$ million<br />
The result from loan losses, net of recovery, decreased 14.9% in<br />
relation to the previous quarter, totaling R$3,854 million in the<br />
quarter. This decrease becomes more significant if one considers<br />
Risk-Adjusted Efficiency Ratio (R.A.E.R) (*) and<br />
Efficiency Ratio (E.R.)<br />
48.2<br />
70.7<br />
49.3<br />
73.1<br />
47.1<br />
70.5<br />
48.5<br />
70.1<br />
47.0<br />
70.9<br />
47.4<br />
70.7<br />
44.4<br />
71.9<br />
46.6<br />
73.9<br />
44.9<br />
72.3<br />
45.8<br />
74.2<br />
45.0<br />
73.5<br />
45.3<br />
75.3<br />
46.6<br />
74.2<br />
45.2<br />
73.4<br />
48.0<br />
73.9<br />
46.1<br />
2Q11 3Q11 4Q11 1Q12 2Q12 3Q12 4Q12 1Q13<br />
Quarter E.R. (%) Quarter R.A.E.R. (%)<br />
E.R. Cumulative figure of the last 12 months (%) R.A.E.R. Cumulative figure of the last 12 months (%)<br />
(*) The criteria for calculating the ratios are detailed on page 24.<br />
The risk-adjusted efficiency ratio, in the full concept (that includes<br />
all expenses), for the first quarter of 2013 reached 72.8%, a<br />
decrease of 60 basis points in relation to the previous quarter,<br />
impacted by reduced expenses for allowance for loan and lease<br />
losses and retained claims. In the last 12 months, the risk-adjusted<br />
efficiency ratio reached 73.9%.<br />
In the first quarter of 2013, the efficiency ratio, in the full concept<br />
(that includes all expenses), reached 48.0%, corresponding to a<br />
140 basis point increase from the previous quarter. In the 12-<br />
month period, the efficiency ratio reached 46.1%, an<br />
improvement of 50 basis points in relation to the same period of<br />
the previous year.<br />
72.8<br />
Management Discussion & Analysis<br />
<strong>Itaú</strong> Unibanco Holding S.A.<br />
11


