

IRR310313.pdf - Banco Itaú
IRR310313.pdf - Banco Itaú
IRR310313.pdf - Banco Itaú

You also want an ePaper? Increase the reach of your titles
YUMPU automatically turns print PDFs into web optimized ePapers that Google loves.
Banking Operations & Insurance Operations<br />
Evolution of Efficiency Ratio, Risk-Adjusted Efficiency Ratio and Annualized Return on Average Equity<br />
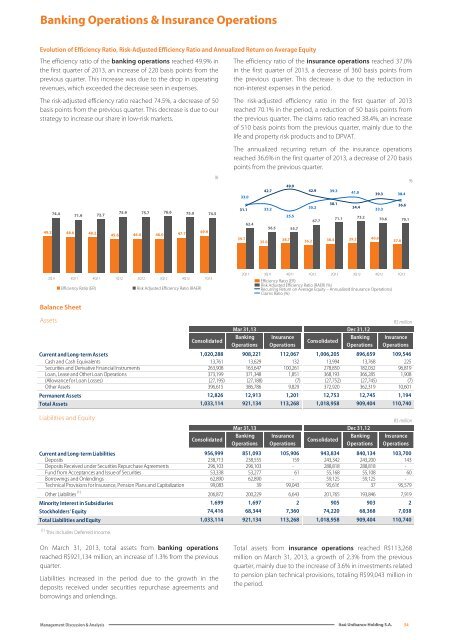
The efficiency ratio of the banking operations reached 49.9% in<br />
the first quarter of 2013, an increase of 220 basis points from the<br />
previous quarter. This increase was due to the drop in operating<br />
revenues, which exceeded the decrease seen in expenses.<br />
The risk-adjusted efficiency ratio reached 74.5%, a decrease of 50<br />
basis points from the previous quarter. This decrease is due to our<br />
strategy to increase our share in low-risk markets.<br />
74.4<br />
71.9 72.7<br />
49.2 48.6 48.2<br />
75.9 75.7 76.6 75.0 74.5<br />
45.6 46.0 46.0 47.7<br />
49.9<br />
%<br />
The efficiency ratio of the insurance operations reached 37.0%<br />
in the first quarter of 2013, a decrease of 360 basis points from<br />
the previous quarter. This decrease is due to the reduction in<br />
non-interest expenses in the period.<br />
The risk-adjusted efficiency ratio in the first quarter of 2013<br />
reached 70.1% in the period, a reduction of 50 basis points from<br />
the previous quarter. The claims ratio reached 38.4%, an increase<br />
of 510 basis points from the previous quarter, mainly due to the<br />
life and property risk products and to DPVAT.<br />
The annualized recurring return of the insurance operations<br />
reached 36.6% in the first quarter of 2013, a decrease of 270 basis<br />
points from the previous quarter.<br />
33.0<br />
31.1<br />
39.7<br />
62.4<br />
35.0<br />
42.7<br />
33.2<br />
49.9<br />
25.5<br />
56.5 55.7<br />
42.9<br />
35.2<br />
67.7<br />
39.3<br />
41.0<br />
38.1 36.6<br />
34.4<br />
33.3<br />
71.1 73.2<br />
70.6 70.1<br />
38.7 36.2 38.4 39.2 40.6<br />
39.3<br />
37.0<br />
38.4<br />
%<br />
2Q11 3Q11 4Q11 1Q12 2Q12 3Q12 4Q12 1Q13<br />
Efficiency Ratio (ER)<br />
Risk Adjusted Efficiency Ratio (RAER)<br />
2Q11 3Q11 4Q11 1Q12 2Q12 3Q12 4Q12 1Q13<br />
Efficiency Ratio (ER)<br />
Risk Adjusted Efficiency Ratio (RAER) (%)<br />
Recurring Return on Average Equity – Annualized (Insurance Operations)<br />
Claims Ratio (%)<br />
Balance Sheet<br />
Assets<br />
Liabilities and Equity<br />
(1)<br />
This includes Deferred Income.<br />
Consolidated<br />
Mar 31,13<br />
Banking<br />
Operations<br />
Insurance<br />
Operations<br />
Consolidated<br />
Dec 31,12<br />
Banking<br />
Operations<br />
R$ million<br />
Insurance<br />
Operations<br />
Current and Long-term Assets 1,020,288 908,221 112,067 1,006,205 896,659 109,546<br />
Cash and Cash Equivalents 13,761 13,629 132 13,994 13,768 225<br />
Securities and Derivative Financial Instruments 263,908 163,647 100,261 278,850 182,032 96,819<br />
Loan, Lease and Other Loan Operations 373,199 371,348 1,851 368,193 366,285 1,908<br />
(Allowance for Loan Losses) (27,195) (27,188) (7) (27,752) (27,745) (7)<br />
Other Assets 396,615 386,786 9,829 372,920 362,319 10,601<br />
Permanent Assets 12,826 12,913 1,201 12,753 12,745 1,194<br />
Total Assets 1,033,114 921,134 113,268 1,018,958 909,404 110,740<br />
Consolidated<br />
Mar 31,13<br />
Banking<br />
Operations<br />
Insurance<br />
Operations<br />
Consolidated<br />
Dec 31,12<br />
Banking<br />
Operations<br />
R$ million<br />
Insurance<br />
Operations<br />
Current and Long-term Liabilities 956,999 851,093 105,906 943,834 840,134 103,700<br />
Deposits 238,713 238,555 159 243,342 243,200 143<br />
Deposits Received under Securities Repurchase Agreements 296,103 296,103 - 288,818 288,818 -<br />
Fund from Acceptances and Issue of Securities 53,338 53,277 61 55,168 55,108 60<br />
Borrowings and Onlendings 62,890 62,890 - 59,125 59,125 -<br />
Technical Provisions for Insurance, Pension Plans and Capitalization 99,083 39 99,043 95,616 37 95,579<br />
Other Liabilities (1) 206,872 200,229 6,643 201,765 193,846 7,919<br />
Minority Interest in Subsidiaries 1,699 1,697 2 905 903 2<br />
Stockholders' Equity 74,416 68,344 7,360 74,220 68,368 7,038<br />
Total Liabilities and Equity 1,033,114 921,134 113,268 1,018,958 909,404 110,740<br />
On March 31, 2013, total assets from banking operations<br />
reached R$921,134 million, an increase of 1.3% from the previous<br />
quarter.<br />
Liabilities increased in the period due to the growth in the<br />
deposits received under securities repurchase agreements and<br />
borrowings and onlendings.<br />
Total assets from insurance operations reached R$113,268<br />
million on March 31, 2013, a growth of 2.3% from the previous<br />
quarter, mainly due to the increase of 3.6% in investments related<br />
to pension plan technical provisions, totaling R$99,043 million in<br />
the period.<br />
Management Discussion & Analysis<br />
<strong>Itaú</strong> Unibanco Holding S.A.<br />
54


