

IRR310313.pdf - Banco Itaú
IRR310313.pdf - Banco Itaú
IRR310313.pdf - Banco Itaú

You also want an ePaper? Increase the reach of your titles
YUMPU automatically turns print PDFs into web optimized ePapers that Google loves.
Analysis of Net Income<br />
Result from Loan Losses<br />
Variation<br />
R$ million<br />
1Q13 4Q12 1Q12<br />
1Q13 -4Q12 1Q13 -1Q12<br />
Expenses for Provision for Loan and Lease Losses (4,939) (5,741) (6,210) 801 -14.0% 1,271 -20.5%<br />
Income from Recovery of Loans Written Off as Losses 1,086 1,210 1,212 (124) -10.3% (126) -10.4%<br />
Result from Loan and Lease Losses (3,854) (4,531) (4,998) 677 -14.9% 1,145 -22.9%<br />
The result from loan and lease losses, net of recovery, totaled<br />
R$3,854 million in the quarter, a decrease of 14.9% compared to<br />
the previous quarter, despite of the impact of seasonal factors in<br />
the first quarter, such as the larger concentration of payments of<br />
taxes on properties, expenses related to the beginning of the<br />
school year, and other.<br />
The expenses for provisions for loan losses dropped R$801<br />
million in the quarter (14.0%) to R$4,939 million, and the income<br />
from the recovery of credits that had previously been written off<br />
as losses decreased R$124 million (10.3%), to R$1,086 million.<br />
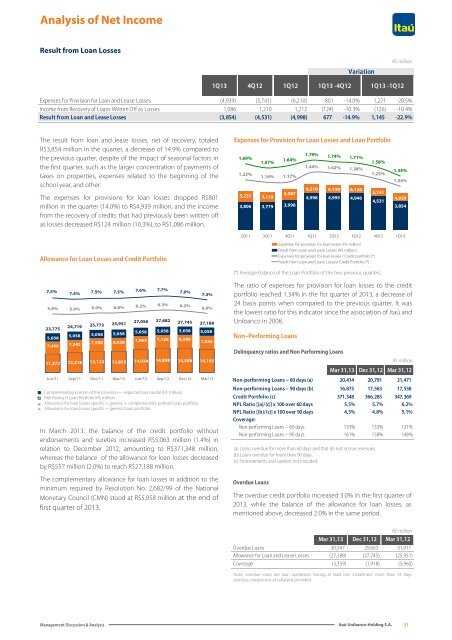
Expenses for Provision for Loan Losses and Loan Portfolio<br />
1.79%<br />
1.69%<br />
1.74%<br />
1.64%<br />
1.71%<br />
1.57%<br />
1.58%<br />
1.44% 1.42% 1.38%<br />
1.34%<br />
1.23%<br />
1.25%<br />
1.16% 1.17%<br />
1.04%<br />
6,210 6,139 6,120<br />
5,237<br />
5,587<br />
5,741<br />
5,110<br />
4,998 4,995 4,946<br />
4,939<br />
4,531<br />
3,806 3,779 3,998<br />
3,854<br />
2Q11 3Q11 4Q11 1Q12 2Q12 3Q12 4Q12 1Q13<br />
Allowance for Loan Losses and Credit Portfolio<br />
Expenses for provision for loan losses (R$ million)<br />
Result from Loan and Lease Losses (R$ million)<br />
Expenses for provision for loan losses / Credit portfolio (*)<br />
Result from Loan and Lease Losses/ Credit Portfolio (*)<br />
(*) Average balance of the Loan Portfolio of the two previous quarters.<br />
7.5%<br />
5.9%<br />
23,775<br />
5,058<br />
7,444<br />
7.4% 7.5% 7.5% 7.6% 7.7%<br />
5.9%<br />
6.0%<br />
24,719 25,772 25,951<br />
5,058 5,058<br />
7,342 7,590<br />
5,058<br />
8,038<br />
7.6%<br />
27,056 27,682 27,745 27,188<br />
5,058 5,058 5,058 5,058<br />
7,964 7,726 8,099<br />
7,935<br />
11,272 12,318 13,123 12,855 14,034 14,898 14,588 14,195<br />
Complementary portion of the provision— expected loss model (R$ million)<br />
Risk Rating H Loan Portfolio (R$ million)<br />
Allowance for loan losses specific + generic + complementary portion/Loan portfolio<br />
Allowance for loan losses specific + generic/Loan portfolio<br />
7.3%<br />
6.0% 6.2% 6.3% 6.2%<br />
6.0%<br />
Jun/11 Sep/11 Dec/11 Mar/12 Jun/12 Sep/12 Dec/12 Mar/13<br />
In March 2013, the balance of the credit portfolio without<br />
endorsements and sureties increased R$5,063 million (1.4%) in<br />
relation to December 2012, amounting to R$371,348 million,<br />
whereas the balance of the allowance for loan losses decreased<br />
by R$557 million (2.0%) to reach R$27,188 million.<br />
The complementary allowance for loan losses in addition to the<br />
minimum required by Resolution No. 2,682/99 of the National<br />
Monetary Council (CMN) stood at R$5,058 million at the end of<br />
first quarter of 2013.<br />
The ratio of expenses for provision for loan losses to the credit<br />
portfolio reached 1.34% in the fist quarter of 2013, a decrease of<br />
24 basis points when compared to the previous quarter. It was<br />
the lowest ratio for this indicator since the association of <strong>Itaú</strong> and<br />
Unibanco in 2008.<br />
Non–Performing Loans<br />
Delinquency ratios and Non Performing Loans<br />
R$ million<br />
Mar 31,13 Dec 31,12 Mar 31,12<br />
Non-performing Loans – 60 days (a) 20,414 20,791 21,471<br />
Non-performing Loans – 90 days (b) 16,875 17,563 17,558<br />
Credit Portfolio (c) 371,348 366,285 347,369<br />
NPL Ratio [(a)/(c)] x 100 over 60 days 5.5% 5.7% 6.2%<br />
NPL Ratio [(b)/(c)] x 100 over 90 days 4.5% 4.8% 5.1%<br />
Coverage:<br />
Non-performing Loans – 60 days 133% 133% 121%<br />
Non-performing Loans – 90 days 161% 158% 148%<br />
(a) Loans overdue for more than 60 days and that do not accrue revenues.<br />
(b) Loans overdue for more than 90 days.<br />
(c) Endorsements and sureties not included.<br />
Overdue Loans<br />
The overdue credit portfolio increased 3.0% in the first quarter of<br />
2013, while the balance of the allowance for loan losses, as<br />
mentioned above, decreased 2.0% in the same period.<br />
R$ million<br />
Mar 31,13 Dec 31,12 Mar 31,12<br />
Overdue Loans 30,547 29,663 31,911<br />
Allowance for Loan and Lease Losses (27,188) (27,745) (25,951)<br />
Coverage (3,359) (1,918) (5,960)<br />
Note: overdue loans are loan operations having at least one installment more than 14 days<br />
overdue, irrespective of collateral provided.<br />
Management Discussion & Analysis<br />
<strong>Itaú</strong> Unibanco Holding S.A.<br />
21


