

IRR310313.pdf - Banco Itaú
IRR310313.pdf - Banco Itaú
IRR310313.pdf - Banco Itaú

Create successful ePaper yourself
Turn your PDF publications into a flip-book with our unique Google optimized e-Paper software.
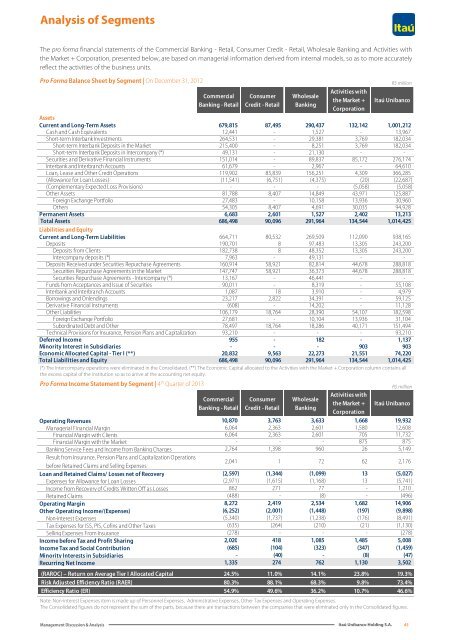
Analysis of Segments<br />
The pro forma financial statements of the Commercial Banking - Retail, Consumer Credit - Retail, Wholesale Banking and Activities with<br />
the Market + Corporation, presented below, are based on managerial information derived from internal models, so as to more accurately<br />
reflect the activities of the business units.<br />
Pro Forma Balance Sheet by Segment | On December 31, 2012<br />
Pro Forma Income Statement by Segment | 4 th Quarter of 2013<br />
Commercial<br />
Banking - Retail<br />
Consumer<br />
Credit - Retail<br />
Wholesale<br />
Banking<br />
Activities with<br />
the Market +<br />
Corporation<br />
Note: Non-interest Expenses item is made up of Personnel Expenses, Administrative Expenses, Other Tax Expenses and Operating Expenses.<br />
The Consolidated figures do not represent the sum of the parts, because there are transactions between the companies that were eliminated only in the Consolidated figures.<br />
R$ million<br />
<strong>Itaú</strong> Unibanco<br />
Assets<br />
Current and Long-Term Assets 679,815 87,495 290,437 132,142 1,001,212<br />
Cash and Cash Equivalents 12,441 - 1,527 - 13,967<br />
Short-term Interbank Investments 264,531 - 29,381 3,769 182,034<br />
Short-term Interbank Deposits in the Market 215,400 - 8,251 3,769 182,034<br />
Short-term Interbank Deposits in Intercompany (*) 49,131 - 21,130 - -<br />
Securities and Derivative Financial Instruments 151,014 - 89,837 85,172 276,174<br />
Interbank and Interbranch Accounts 61,679 - 2,967 - 64,610<br />
Loan, Lease and Other Credit Operations 119,902 85,839 156,251 4,309 366,285<br />
(Allowance for Loan Losses) (11,541) (6,751) (4,375) (20) (22,687)<br />
(Complementary Expected Loss Provisions) - - - (5,058) (5,058)<br />
Other Assets 81,788 8,407 14,849 43,971 125,887<br />
Foreign Exchange Portfolio 27,483 - 10,158 13,936 30,960<br />
Others 54,305 8,407 4,691 30,035 94,928<br />
Permanent Assets 6,683 2,601 1,527 2,402 13,213<br />
Total Assets 686,498 90,096 291,964 134,544 1,014,425<br />
Liabilities and Equity<br />
Current and Long-Term Liabilities 664,711 80,532 269,509 112,090 938,165<br />
Deposits 190,701 8 97,483 13,305 243,200<br />
Deposits from Clients 182,738 8 48,352 13,305 243,200<br />
Intercompany deposits (*) 7,963 - 49,131 - -<br />
Deposits Received under Securities Repurchase Agreements 160,914 58,921 82,814 44,678 288,818<br />
Securities Repurchase Agreements in the Market 147,747 58,921 36,373 44,678 288,818<br />
Securities Repurchase Agreements - Intercompany (*) 13,167 - 46,441 - -<br />
Funds from Acceptances and Issue of Securities 90,011 - 8,319 - 55,108<br />
Interbank and Interbranch Accounts 1,087 18 3,910 - 4,979<br />
Borrowings and Onlendings 23,217 2,822 34,391 - 59,125<br />
Derivative Financial Instruments (608) - 14,202 - 11,128<br />
Other Liabilities 106,179 18,764 28,390 54,107 182,598<br />
Foreign Exchange Portfolio 27,681 - 10,104 13,936 31,104<br />
Subordinated Debt and Other 78,497 18,764 18,286 40,171 151,494<br />
Technical Provisions for Insurance, Pension Plans and Capitalization 93,210 - - - 93,210<br />
Deferred Income 955 - 182 - 1,137<br />
Minority Interest in Subsidiaries - - - 903 903<br />
Economic Allocated Capital - Tier I (**) 20,832 9,563 22,273 21,551 74,220<br />
Total Liabilities and Equity 686,498 90,096 291,964 134,544 1,014,425<br />
(*) The Intercompany operations were eliminated in the Consolidated. (**) The Economic Capital allocated to the Activities with the Market + Corporation column contains all<br />
the excess capital of the institution so as to arrive at the accounting net equity.<br />
Commercial<br />
Banking - Retail<br />
Consumer<br />
Credit - Retail<br />
Wholesale<br />
Banking<br />
Activities with<br />
the Market +<br />
Corporation<br />
R$ million<br />
<strong>Itaú</strong> Unibanco<br />
Operating Revenues 10,870 3,763 3,633 1,668 19,932<br />
Managerial Financial Margin 6,064 2,363 2,601 1,580 12,608<br />
Financial Margin with Clients 6,064 2,363 2,601 705 11,732<br />
Financial Margin with the Market - - - 875 875<br />
Banking Service Fees and Income from Banking Charges 2,764 1,398 960 26 5,149<br />
Result from Insurance, Pension Plans and Capitalization Operations<br />
before Retained Claims and Selling Expenses<br />
2,041 1 72 62 2,176<br />
Loan and Retained Claims/ Losses net of Recovery (2,597) (1,344) (1,099) 13 (5,027)<br />
Expenses for Allowance for Loan Losses (2,971) (1,615) (1,168) 13 (5,741)<br />
Income from Recovery of Credits Written Off as Losses 862 271 77 - 1,210<br />
Retained Claims (488) - (8) - (496)<br />
Operating Margin 8,272 2,419 2,534 1,682 14,906<br />
Other Operating Income/(Expenses) (6,252) (2,001) (1,448) (197) (9,898)<br />
Non-interest Expenses (5,340) (1,737) (1,238) (176) (8,491)<br />
Tax Expenses for ISS, PIS, Cofins and Other Taxes (635) (264) (210) (21) (1,130)<br />
Selling Expenses From Insurance (278) - - - (278)<br />
Income before Tax and Profit Sharing 2,020 418 1,085 1,485 5,008<br />
Income Tax and Social Contribution (685) (104) (323) (347) (1,459)<br />
Minority Interests in Subsidiaries - (40) - (8) (47)<br />
Recurring Net Income 1,335 274 762 1,130 3,502<br />
(RAROC) – Return on Average Tier I Allocated Capital 24.5% 11.0% 14.1% 23.8% 19.3%<br />
Risk Adjusted Efficiency Ratio (RAER) 80.3% 88.1% 68.3% 9.8% 73.4%<br />
Efficiency Ratio (ER) 54.9% 49.6% 36.2% 10.7% 46.6%<br />
Management Discussion & Analysis <strong>Itaú</strong> Unibanco Holding S.A. 45


