

IRR310313.pdf - Banco Itaú
IRR310313.pdf - Banco Itaú
IRR310313.pdf - Banco Itaú

You also want an ePaper? Increase the reach of your titles
YUMPU automatically turns print PDFs into web optimized ePapers that Google loves.
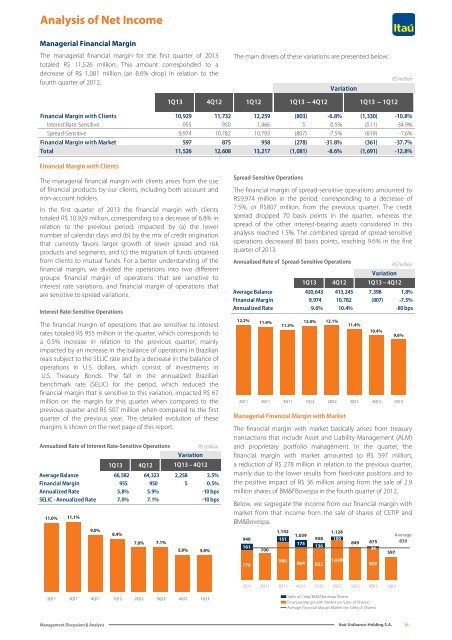
Analysis of Net Income<br />
Managerial Financial Margin<br />
The managerial financial margin for the first quarter of 2013<br />
totaled R$ 11,526 million. This amount corresponded to a<br />
decrease of R$ 1,081 million (an 8.6% drop) in relation to the<br />
fourth quarter of 2012.<br />
1Q13 4Q12 1Q12<br />
The main drivers of these variations are presented below:<br />
1Q13 ‒ 4Q12<br />
Variation<br />
1Q13 ‒ 1Q12<br />
R$ million<br />
Financial Margin with Clients 10,929 11,732 12,259 (803) -6.8% (1,330) -10.8%<br />
Interest Rate-Sensitive 955 950 1,466 5 0.5% (511) -34.9%<br />
Spread-Sensitive 9,974 10,782 10,793 (807) -7.5% (819) -7.6%<br />
Financial Margin with Market 597 875 958 (278) -31.8% (361) -37.7%<br />
Total 11,526 12,608 13,217 (1,081) -8.6% (1,691) -12.8%<br />
Financial Margin with Clients<br />
The managerial financial margin with clients arises from the use<br />
of financial products by our clients, including both account and<br />
non-account holders.<br />
In the first quarter of 2013 the financial margin with clients<br />
totaled R$ 10,929 million, corresponding to a decrease of 6.8% in<br />
relation to the previous period, impacted by (a) the lower<br />
number of calendar days and (b) by the mix of credit origination<br />
that currently favors larger growth of lower spread and risk<br />
products and segments, and (c) the migration of funds obtained<br />
from clients to mutual funds. For a better understanding of the<br />
financial margin, we divided the operations into two different<br />
groups: financial margin of operations that are sensitive to<br />
interest rate variations, and financial margin of operations that<br />
are sensitive to spread variations.<br />
Interest Rate-Sensitive Operations<br />
The financial margin of operations that are sensitive to interest<br />
rates totaled R$ 955 million in the quarter, which corresponds to<br />
a 0.5% increase in relation to the previous quarter, mainly<br />
impacted by an increase in the balance of operations in Brazilian<br />
reais subject to the SELIC rate and by a decrease in the balance of<br />
operations in U.S. dollars, which consist of investments in<br />
U.S. Treasury Bonds. The fall in the annualized Brazilian<br />
benchmark rate (SELIC) for the period, which reduced the<br />
financial margin that is sensitive to this variation, impacted R$ 67<br />
million on the margin for this quarter when compared to the<br />
previous quarter and R$ 507 million when compared to the first<br />
quarter of the previous year. The detailed evolution of these<br />
margins is shown on the next page of this report.<br />
Annualized Rate of Interest Rate-Sensitive Operations<br />
R$ million<br />
Variation<br />
1Q13 4Q12 1Q13 – 4Q12<br />
Average Balance 66,582 64,323 2,258 3.5%<br />
Financial Margin 955 950 5 0.5%<br />
Annualized Rate 5.8% 5.9% -10 bps<br />
SELIC - Annualized Rate 7.0% 7.1% -10 bps<br />
11.0% 11.1%<br />
9.0%<br />
8.4%<br />
7.0% 7.1%<br />
5.9% 5.8%<br />
Spread-Sensitive Operations<br />
The financial margin of spread-sensitive operations amounted to<br />
R$9,974 million in the period, corresponding to a decrease of<br />
7.5%, or R$807 million, from the previous quarter. The credit<br />
spread dropped 70 basis points in the quarter, whereas the<br />
spread of the other interest-bearing assets considered in this<br />
analysis reached 1.5%. The combined spread of spread-sensitive<br />
operations decreased 80 basis points, reaching 9.6% in the first<br />
quarter of 2013.<br />
Annualized Rate of Spread-Sensitive Operations<br />
R$ million<br />
Variation<br />
1Q13 4Q12 1Q13 – 4Q12<br />
Average Balance 420,643 413,245 7,398 1.8%<br />
Financial Margin 9,974 10,782 (807) -7.5%<br />
Annualized Rate 9.6% 10.4% -80 bps<br />
12.2%<br />
Managerial Financial Margin with Market<br />
940<br />
161<br />
779<br />
11.9%<br />
700<br />
11.3%<br />
The financial margin with market basically arises from treasury<br />
transactions that include Asset and Liability Management (ALM)<br />
and proprietary portfolio management. In the quarter, the<br />
financial margin with market amounted to R$ 597 million,<br />
a reduction of R$ 278 million in relation to the previous quarter,<br />
mainly due to the lower results from fixed-rate positions and to<br />
the positive impact of R$ 36 million arising from the sale of 2.9<br />
million shares of BM&FBovespa in the fourth quarter of 2012.<br />
Below, we segregate the income from our financial margin with<br />
market from that income from the sale of shares of CETIP and<br />
BM&Bovespa.<br />
1,142<br />
151<br />
990<br />
1,039<br />
175<br />
12.0% 12.1%<br />
958<br />
136<br />
864 822<br />
1,128<br />
100<br />
1,028<br />
11.4%<br />
10.4%<br />
849 875<br />
36<br />
839<br />
597<br />
9.6%<br />
2Q11 3Q11 4Q11 1Q12 2Q12 3Q12 4Q12 1Q13<br />
Average<br />
830<br />
1Q11 2Q11 3Q11 4Q11 1Q12 2Q12 3Q12 4Q12 1Q13<br />
2Q11 3Q11 4Q11 1Q12 2Q12 3Q12 4Q12 1Q13<br />
Sales of Cetip/BM&FBovespa Shares<br />
Financial Margin with Market (ex-Sales of Shares)<br />
Average Financial Margin Market (ex-Sales of Shares)<br />
Management Discussion & Analysis<br />
<strong>Itaú</strong> Unibanco Holding S.A.<br />
16


