

IRR310313.pdf - Banco Itaú
IRR310313.pdf - Banco Itaú
IRR310313.pdf - Banco Itaú

You also want an ePaper? Increase the reach of your titles
YUMPU automatically turns print PDFs into web optimized ePapers that Google loves.
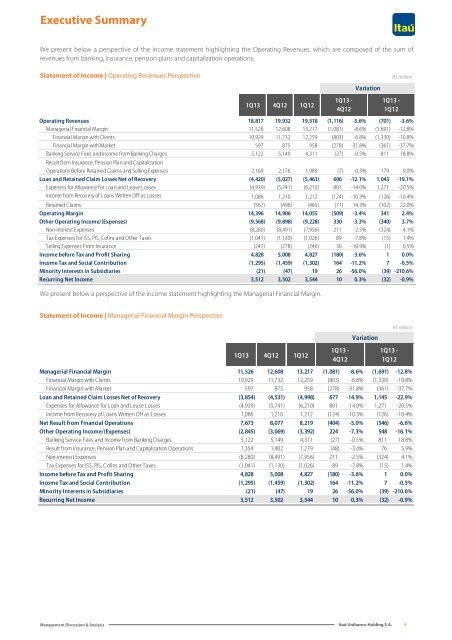
Executive Summary<br />
We present below a perspective of the income statement highlighting the Operating Revenues, which are composed of the sum of<br />
revenues from banking, insurance, pension plans and capitalization operations.<br />
Statement of Income | Operating Revenues Perspective<br />
1Q13 4Q12 1Q12<br />
Variation<br />
Operating Revenues 18,817 19,932 19,518 (1,116) -5.6% (701) -3.6%<br />
Managerial Financial Margin 11,526 12,608 13,217 (1,081) -8.6% (1,691) -12.8%<br />
Financial Margin with Clients 10,929 11,732 12,259 (803) -6.8% (1,330) -10.8%<br />
Financial Margin with Market 597 875 958 (278) -31.8% (361) -37.7%<br />
Banking Service Fees and Income from Banking Charges 5,122 5,149 4,311 (27) -0.5% 811 18.8%<br />
Result from Insurance, Pension Plan and Capitalization<br />
Operations Before Retained Claims and Selling Expenses 2,169 2,176 1,989 (7) -0.3% 179 9.0%<br />
Loan and Retained Claim Losses Net of Recovery (4,420) (5,027) (5,463) 606 -12.1% 1,043 -19.1%<br />
Expenses for Allowance for Loan and Lease Losses (4,939) (5,741) (6,210) 801 -14.0% 1,271 -20.5%<br />
Income from Recovery of Loans Written Off as Losses 1,086 1,210 1,212 (124) -10.3% (126) -10.4%<br />
Retained Claims (567) (496) (465) (71) 14.3% (102) 22.0%<br />
Operating Margin 14,396 14,906 14,055 (509) -3.4% 341 2.4%<br />
Other Operating Income/(Expenses) (9,568) (9,898) (9,228) 330 -3.3% (340) 3.7%<br />
Non-interest Expenses (8,280) (8,491) (7,956) 211 -2.5% (324) 4.1%<br />
Tax Expenses for ISS, PIS, Cofins and Other Taxes (1,041) (1,130) (1,026) 89 -7.8% (15) 1.4%<br />
Selling Expenses From Insurance (247) (278) (246) 30 -10.9% (1) 0.5%<br />
Income before Tax and Profit Sharing 4,828 5,008 4,827 (180) -3.6% 1 0.0%<br />
Income Tax and Social Contribution (1,295) (1,459) (1,302) 164 -11.2% 7 -0.5%<br />
Minority Interests in Subsidiaries (21) (47) 19 26 -56.0% (39) -210.6%<br />
Recurring Net Income 3,512 3,502 3,544 10 0.3% (32) -0.9%<br />
We present below a perspective of the income statement highlighting the Managerial Financial Margin.<br />
1Q13 -<br />
4Q12<br />
1Q13 -<br />
1Q12<br />
R$ million<br />
Statement of Income | Managerial Financial Margin Perspective<br />
1Q13 4Q12 1Q12<br />
Variation<br />
Managerial Financial Margin 11,526 12,608 13,217 (1,081) -8.6% (1,691) -12.8%<br />
Financial Margin with Clients 10,929 11,732 12,259 (803) -6.8% (1,330) -10.8%<br />
Financial Margin with Market 597 875 958 (278) -31.8% (361) -37.7%<br />
Loan and Retained Claim Losses Net of Recovery (3,854) (4,531) (4,998) 677 -14.9% 1,145 -22.9%<br />
Expenses for Allowance for Loan and Lease Losses (4,939) (5,741) (6,210) 801 -14.0% 1,271 -20.5%<br />
Income from Recovery of Loans Written Off as Losses 1,086 1,210 1,212 (124) -10.3% (126) -10.4%<br />
Net Result from Financial Operations 7,673 8,077 8,219 (404) -5.0% (546) -6.6%<br />
Other Operating Income/(Expenses) (2,845) (3,069) (3,392) 224 -7.3% 548 -16.1%<br />
Banking Service Fees and Income from Banking Charges 5,122 5,149 4,311 (27) -0.5% 811 18.8%<br />
Result from Insurance, Pension Plan and Capitalization Operations 1,354 1,402 1,279 (48) -3.4% 76 5.9%<br />
Non-interest Expenses (8,280) (8,491) (7,956) 211 -2.5% (324) 4.1%<br />
Tax Expenses for ISS, PIS, Cofins and Other Taxes (1,041) (1,130) (1,026) 89 -7.8% (15) 1.4%<br />
Income before Tax and Profit Sharing 4,828 5,008 4,827 (180) -3.6% 1 0.0%<br />
Income Tax and Social Contribution (1,295) (1,459) (1,302) 164 -11.2% 7 -0.5%<br />
Minority Interests in Subsidiaries (21) (47) 19 26 -56.0% (39) -210.6%<br />
Recurring Net Income 3,512 3,502 3,544 10 0.3% (32) -0.9%<br />
1Q13 -<br />
4Q12<br />
1Q13 -<br />
1Q12<br />
R$ million<br />
Management Discussion & Analysis<br />
<strong>Itaú</strong> Unibanco Holding S.A.<br />
9


