

IRR310313.pdf - Banco Itaú
IRR310313.pdf - Banco Itaú
IRR310313.pdf - Banco Itaú

Create successful ePaper yourself
Turn your PDF publications into a flip-book with our unique Google optimized e-Paper software.
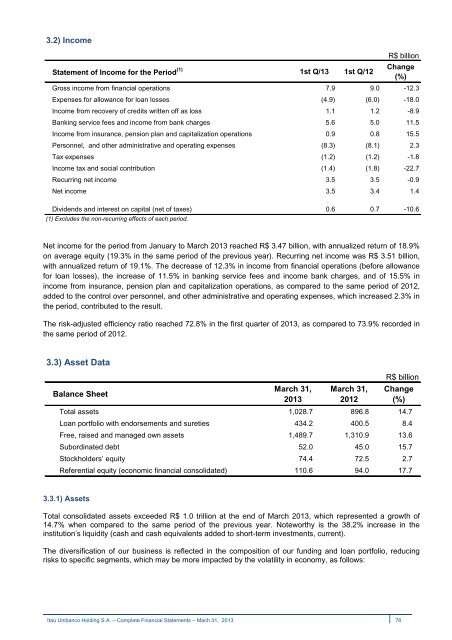
3.2) Income<br />
R$ billion<br />
Statement of Income for the Period (1) 1st Q/13 1st Q/12<br />
Change<br />
(%)<br />
Gross income from financial operations 7.9 9.0 -12.3<br />
Expenses for allowance for loan losses (4.9) (6.0) -18.0<br />
Income from recovery of credits written off as loss 1.1 1.2 -8.9<br />
Banking service fees and income from bank charges 5.6 5.0 11.5<br />
Income from insurance, pension plan and capitalization operations 0.9 0.8 15.5<br />
Personnel, and other administrative and operating expenses (8.3) (8.1) 2.3<br />
Tax expenses (1.2) (1.2) -1.8<br />
Income tax and social contribution (1.4) (1.8) -22.7<br />
Recurring net income 3.5 3.5 -0.9<br />
Net income 3.5 3.4 1.4<br />
Dividends and interest on capital (net of taxes) 0.6 0.7 -10.6<br />
(1) Excludes the non-recurring effects of each period.<br />
Net income for the period from January to March 2013 reached R$ 3.47 billion, with annualized return of 18.9%<br />
on average equity (19.3% in the same period of the previous year). Recurring net income was R$ 3.51 billion,<br />
with annualized return of 19.1%. The decrease of 12.3% in income from financial operations (before allowance<br />
for loan losses), the increase of 11.5% in banking service fees and income bank charges, and of 15.5% in<br />
income from insurance, pension plan and capitalization operations, as compared to the same period of 2012,<br />
added to the control over personnel, and other administrative and operating expenses, which increased 2.3% in<br />
the period, contributed to the result.<br />
The risk-adjusted efficiency ratio reached 72.8% in the first quarter of 2013, as compared to 73.9% recorded in<br />
the same period of 2012.<br />
3.3) Asset Data<br />
Balance Sheet<br />
March 31,<br />
2013<br />
March 31,<br />
2012<br />
R$ billion<br />
Change<br />
(%)<br />
Total assets 1,028.7 896.8 14.7<br />
Loan portfolio with endorsements and sureties 434.2 400.5 8.4<br />
Free, raised and managed own assets 1,489.7 1,310.9 13.6<br />
Subordinated debt 52.0 45.0 15.7<br />
Stockholders’ equity 74.4 72.5 2.7<br />
Referential equity (economic financial consolidated) 110.6 94.0 17.7<br />
3.3.1) Assets<br />
Total consolidated assets exceeded R$ 1.0 trillion at the end of March 2013, which represented a growth of<br />
14.7% when compared to the same period of the previous year. Noteworthy is the 38.2% increase in the<br />
institution’s liquidity (cash and cash equivalents added to short-term investments, current).<br />
The diversification of our business is reflected in the composition of our funding and loan portfolio, reducing<br />
risks to specific segments, which may be more impacted by the volatility in economy, as follows:<br />
<strong>Itaú</strong> Unibanco Holding S.A. – Complete Financial Statements – Mach 31, 2013 76


