
You also want an ePaper? Increase the reach of your titles
YUMPU automatically turns print PDFs into web optimized ePapers that Google loves.
MUBARIZ HASANOV<br />
48<br />
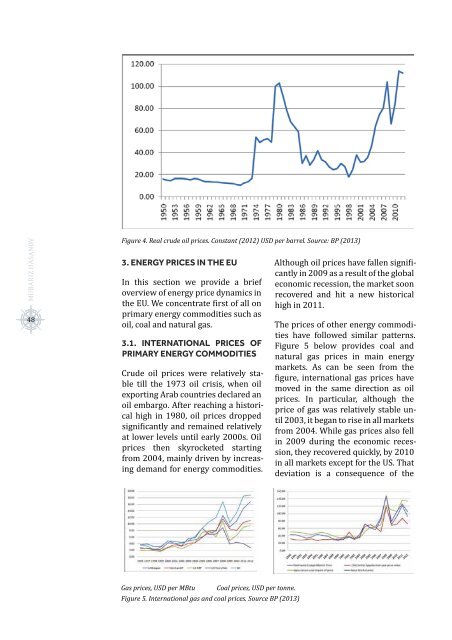
Figure 4. Real crude oil prices. Constant (2012) USD per barrel. Source: BP (2013)<br />
3. ENERGY PRICES IN THE EU<br />
In this section we provide a brief<br />
overview of energy price dynamics in<br />
the EU. We concentrate first of all on<br />
primary energy commodities such as<br />
oil, coal and natural gas.<br />
3.1. INTERNATIONAL PRICES OF<br />
PRIMARY ENERGY COMMODITIES<br />
Crude oil prices were relatively stable<br />
till the 1973 oil crisis, when oil<br />
exporting Arab countries declared an<br />
oil embargo. After reaching a historical<br />
high in 1980, oil prices dropped<br />
significantly and remained relatively<br />
at lower levels until early 2000s. Oil<br />
prices then skyrocketed starting<br />
from 2004, mainly driven by increasing<br />
demand for energy commodities.<br />
Although oil prices have fallen significantly<br />
in 2009 as a result of the global<br />
economic recession, the market soon<br />
recovered and hit a new historical<br />
high in 2011.<br />
The prices of other energy commodities<br />
have followed similar patterns.<br />
Figure 5 below provides coal and<br />
natural gas prices in main energy<br />
markets. As can be seen from the<br />
figure, international gas prices have<br />
moved in the same direction as oil<br />
prices. In particular, although the<br />
price of gas was relatively stable until<br />
2003, it began to rise in all markets<br />
from 2004. While gas prices also fell<br />
in 2009 during the economic recession,<br />
they recovered quickly, by 2010<br />
in all markets except for the US. That<br />
deviation is a consequence of the<br />
Gas prices, USD per MBtu Coal prices, USD per tonne.<br />
Figure 5. International gas and coal prices. Source BP (2013)