DI-770 Oscilloscope provides five virtual instruments in one
DI-770 Oscilloscope provides five virtual instruments in one
DI-770 Oscilloscope provides five virtual instruments in one

You also want an ePaper? Increase the reach of your titles
YUMPU automatically turns print PDFs into web optimized ePapers that Google loves.
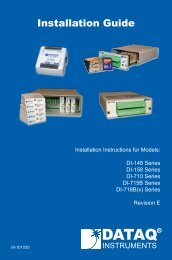
<strong>DI</strong>-<strong>770</strong> and WINDAQ/Scope Manual<br />
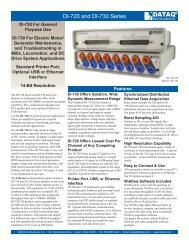
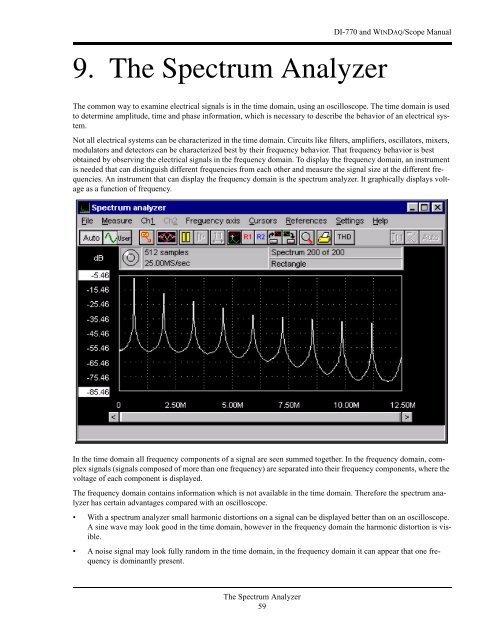
9. The Spectrum Analyzer<br />
The common way to exam<strong>in</strong>e electrical signals is <strong>in</strong> the time doma<strong>in</strong>, us<strong>in</strong>g an oscilloscope. The time doma<strong>in</strong> is used<br />
to determ<strong>in</strong>e amplitude, time and phase <strong>in</strong>formation, which is necessary to describe the behavior of an electrical system.<br />
Not all electrical systems can be characterized <strong>in</strong> the time doma<strong>in</strong>. Circuits like filters, amplifiers, oscillators, mixers,<br />
modulators and detectors can be characterized best by their frequency behavior. That frequency behavior is best<br />
obta<strong>in</strong>ed by observ<strong>in</strong>g the electrical signals <strong>in</strong> the frequency doma<strong>in</strong>. To display the frequency doma<strong>in</strong>, an <strong>in</strong>strument<br />
is needed that can dist<strong>in</strong>guish different frequencies from each other and measure the signal size at the different frequencies.<br />
An <strong>in</strong>strument that can display the frequency doma<strong>in</strong> is the spectrum analyzer. It graphically displays voltage<br />
as a function of frequency.<br />
In the time doma<strong>in</strong> all frequency comp<strong>one</strong>nts of a signal are seen summed together. In the frequency doma<strong>in</strong>, complex<br />
signals (signals composed of more than <strong>one</strong> frequency) are separated <strong>in</strong>to their frequency comp<strong>one</strong>nts, where the<br />
voltage of each comp<strong>one</strong>nt is displayed.<br />
The frequency doma<strong>in</strong> conta<strong>in</strong>s <strong>in</strong>formation which is not available <strong>in</strong> the time doma<strong>in</strong>. Therefore the spectrum analyzer<br />
has certa<strong>in</strong> advantages compared with an oscilloscope.<br />
• With a spectrum analyzer small harmonic distortions on a signal can be displayed better than on an oscilloscope.<br />
A s<strong>in</strong>e wave may look good <strong>in</strong> the time doma<strong>in</strong>, however <strong>in</strong> the frequency doma<strong>in</strong> the harmonic distortion is visible.<br />
• A noise signal may look fully random <strong>in</strong> the time doma<strong>in</strong>, <strong>in</strong> the frequency doma<strong>in</strong> it can appear that <strong>one</strong> frequency<br />
is dom<strong>in</strong>antly present.<br />
The Spectrum Analyzer<br />
59