DI-770 Oscilloscope provides five virtual instruments in one
DI-770 Oscilloscope provides five virtual instruments in one
DI-770 Oscilloscope provides five virtual instruments in one

Create successful ePaper yourself
Turn your PDF publications into a flip-book with our unique Google optimized e-Paper software.
<strong>DI</strong>-<strong>770</strong> and WINDAQ/Scope Manual<br />
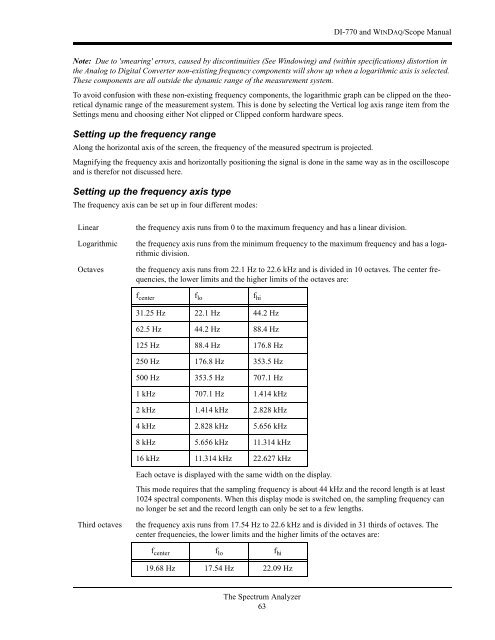
Note: Due to 'smear<strong>in</strong>g' errors, caused by discont<strong>in</strong>uities (See W<strong>in</strong>dow<strong>in</strong>g) and (with<strong>in</strong> specifications) distortion <strong>in</strong><br />
the Analog to Digital Converter non-exist<strong>in</strong>g frequency comp<strong>one</strong>nts will show up when a logarithmic axis is selected.<br />
These comp<strong>one</strong>nts are all outside the dynamic range of the measurement system.<br />
To avoid confusion with these non-exist<strong>in</strong>g frequency comp<strong>one</strong>nts, the logarithmic graph can be clipped on the theoretical<br />
dynamic range of the measurement system. This is d<strong>one</strong> by select<strong>in</strong>g the Vertical log axis range item from the<br />
Sett<strong>in</strong>gs menu and choos<strong>in</strong>g either Not clipped or Clipped conform hardware specs.<br />
Sett<strong>in</strong>g up the frequency range<br />
Along the horizontal axis of the screen, the frequency of the measured spectrum is projected.<br />
Magnify<strong>in</strong>g the frequency axis and horizontally position<strong>in</strong>g the signal is d<strong>one</strong> <strong>in</strong> the same way as <strong>in</strong> the oscilloscope<br />
and is therefor not discussed here.<br />
Sett<strong>in</strong>g up the frequency axis type<br />
The frequency axis can be set up <strong>in</strong> four different modes:<br />
L<strong>in</strong>ear<br />
Logarithmic<br />
Octaves<br />
the frequency axis runs from 0 to the maximum frequency and has a l<strong>in</strong>ear division.<br />
the frequency axis runs from the m<strong>in</strong>imum frequency to the maximum frequency and has a logarithmic<br />
division.<br />
the frequency axis runs from 22.1 Hz to 22.6 kHz and is divided <strong>in</strong> 10 octaves. The center frequencies,<br />
the lower limits and the higher limits of the octaves are:<br />
f center f lo f hi<br />
31.25 Hz 22.1 Hz 44.2 Hz<br />
62.5 Hz 44.2 Hz 88.4 Hz<br />
125 Hz 88.4 Hz 176.8 Hz<br />
250 Hz 176.8 Hz 353.5 Hz<br />
500 Hz 353.5 Hz 707.1 Hz<br />
1 kHz 707.1 Hz 1.414 kHz<br />
2 kHz 1.414 kHz 2.828 kHz<br />
4 kHz 2.828 kHz 5.656 kHz<br />
8 kHz 5.656 kHz 11.314 kHz<br />
16 kHz 11.314 kHz 22.627 kHz<br />
Each octave is displayed with the same width on the display.<br />
This mode requires that the sampl<strong>in</strong>g frequency is about 44 kHz and the record length is at least<br />
1024 spectral comp<strong>one</strong>nts. When this display mode is switched on, the sampl<strong>in</strong>g frequency can<br />
no longer be set and the record length can only be set to a few lengths.<br />
Third octaves<br />
the frequency axis runs from 17.54 Hz to 22.6 kHz and is divided <strong>in</strong> 31 thirds of octaves. The<br />
center frequencies, the lower limits and the higher limits of the octaves are:<br />
f center f lo f hi<br />
19.68 Hz 17.54 Hz 22.09 Hz<br />
The Spectrum Analyzer<br />
63