
You also want an ePaper? Increase the reach of your titles
YUMPU automatically turns print PDFs into web optimized ePapers that Google loves.
2.3. MAIN WINDOW 27<br />
in a graphics window. The third mode can be used whenever image data is displayed<br />
overlaid with region data in a graphics window (the graphics window does not need to be<br />
active for this). In this mode, you can click into any of the segmented regions, and the<br />
histogram of the image within that region will be computed and shown. If you click into a<br />
part of the image that is not contained in any of the overlaid regions, the histogram of the<br />
entire image will be displayed. In the fourth mode, the same mechanism is used for regions<br />
that have gray value information, e.g., image objects created by ÖÙ ÓÑÒ or<br />
ÒÒÐ×. Here, the histogram of the image object you click into will be displayed.<br />
Finally, when the graphics window the image was sent from is cleared, the histogram is<br />
not reset.<br />
When a multi-channel image, e.g., a RGB color image, is sent to the tool, by default the<br />
histogram of the first channel is displayed. The combo box ÒÒÐ lets you select the<br />
channel from which to compute the histogram.<br />
The radio box in the upper center of the tool lets you select whether to display the histogram<br />
with relative or absolute frequencies. When you select ÊÐ, the frequencies of<br />
individual gray values are displayed as percentages; when you select ×, they are displayed<br />
as the actual number of pixels having a particular gray value. See the operator<br />
ÖÝ ×ØÓ in the HALCON Reference <strong>Manual</strong>s for details.<br />
Sometimes it is desirable to suppress the updating of the histogram when new image<br />
data is available, e.g., if you want to select thresholds for a gradient image, but want to<br />
visualize the original image along with the segmentation (see below). To do so, you can<br />
deselect the checkbox ÔØ.<br />
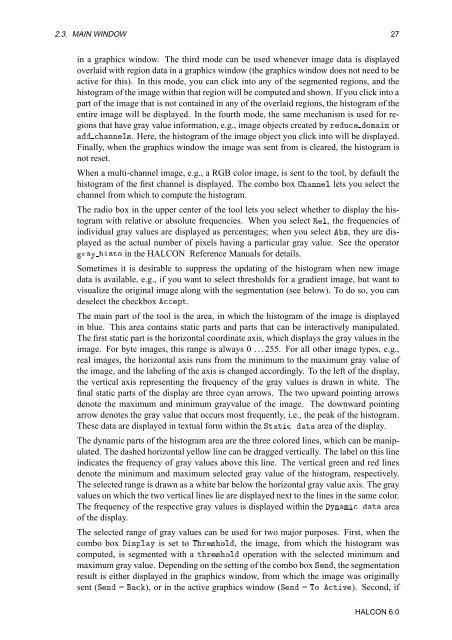
The main part of the tool is the area, in which the histogram of the image is displayed<br />
in blue. This area contains static parts and parts that can be interactively manipulated.<br />
The first static part is the horizontal coordinate axis, which displays the gray values in the<br />
image. For byte images, this range is always 0 . . . 255. For all other image types, e.g.,<br />
real images, the horizontal axis runs from the minimum to the maximum gray value of<br />
the image, and the labeling of the axis is changed accordingly. To the left of the display,<br />
the vertical axis representing the frequency of the gray values is drawn in white. The<br />
final static parts of the display are three cyan arrows. The two upward pointing arrows<br />
denote the maximum and minimum grayvalue of the image. The downward pointing<br />
arrow denotes the gray value that occurs most frequently, i.e., the peak of the histogram.<br />
These data are displayed in textual form within the ËØØ Ø area of the display.<br />
The dynamic parts of the histogram area are the three colored lines, which can be manipulated.<br />
The dashed horizontal yellow line can be dragged vertically. The label on this line<br />
indicates the frequency of gray values above this line. The vertical green and red lines<br />
denote the minimum and maximum selected gray value of the histogram, respectively.<br />
The selected range is drawn as a white bar below the horizontal gray value axis. The gray<br />
values on which the two vertical lines lie are displayed next to the lines in the same color.<br />
The frequency of the respective gray values is displayed within the ÝÒÑ Ø area<br />
of the display.<br />
The selected range of gray values can be used for two major purposes. First, when the<br />
combo box ×ÔÐÝ is set to ÌÖ×ÓÐ, the image, from which the histogram was<br />
computed, is segmented with a ØÖ×ÓÐ operation with the selected minimum and<br />
maximum gray value. Depending on the setting of the combo box ËÒ, the segmentation<br />
result is either displayed in the graphics window, from which the image was originally<br />
sent (ËÒ = ), or in the active graphics window (ËÒ = ÌÓ ØÚ). Second, if<br />
HALCON 6.0