Clinical Trials and Preclinical Infrastructure Asset Map - Life Sciences
Clinical Trials and Preclinical Infrastructure Asset Map - Life Sciences
Clinical Trials and Preclinical Infrastructure Asset Map - Life Sciences

Create successful ePaper yourself
Turn your PDF publications into a flip-book with our unique Google optimized e-Paper software.
29<br />
CLINICAL TRIALS AND PRECLINICAL INFRASTRUCTURE ASSET MAP<br />
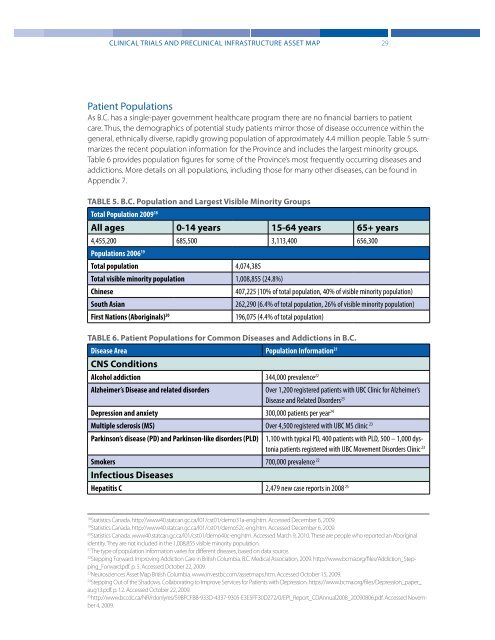
Hepatitis C 2,479 new case reports in 2008 25<br />
TABLE 5. B.C. Population <strong>and</strong> Largest Visible Minority Groups<br />
Total Population 2009 18<br />
All ages 0-14 years 15-64 years 65+ years<br />
4,455,200 685,500 3,113,400 656,300<br />
Populations 2006 19<br />
Total population 4,074,385<br />
Total visible minority population 1,008,855 (24.8%)<br />
Chinese<br />
407,225 (10% of total population, 40% of visible minority population)<br />
South Asian<br />
262,290 (6.4% of total population, 26% of visible minority population)<br />
First Nations (Aboriginals) 20<br />
196,075 (4.4% of total population)<br />
TABLE 6. Patient Populations for Common Diseases <strong>and</strong> Addictions in B.C.<br />
Disease Area Population Information 21<br />
CNS Conditions<br />
Alcohol addiction 344,000 prevalence 22<br />
Alzheimer’s Disease <strong>and</strong> related disorders<br />
Over 1,200 registered patients with UBC Clinic for Alzheimer’s<br />
Disease <strong>and</strong> Related Disorders 23<br />
Depression <strong>and</strong> anxiety 300,000 patients per year 24<br />
Multiple sclerosis (MS) Over 4,500 registered with UBC MS clinic 23<br />
Parkinson’s disease (PD) <strong>and</strong> Parkinson-like disorders (PLD) 1,100 with typical PD, 400 patients with PLD, 500 – 1,000 dystonia<br />
patients registered with UBC Movement Disorders Clinic 23<br />
Smokers 700,000 prevalence 22<br />
Infectious Diseases<br />
Patient Populations<br />
As B.C. has a single-payer government healthcare program there are no financial barriers to patient<br />
care. Thus, the demographics of potential study patients mirror those of disease occurrence within the<br />
general, ethnically diverse, rapidly growing population of approximately 4.4 million people. Table 5 summarizes<br />
the recent population information for the Province <strong>and</strong> includes the largest minority groups.<br />
Table 6 provides population figures for some of the Province’s most frequently occurring diseases <strong>and</strong><br />
addictions. More details on all populations, including those for many other diseases, can be found in<br />
Appendix 7.<br />
18<br />
Statistics Canada. http://www40.statcan.gc.ca/l01/cst01/demo31a-eng.htm. Accessed December 6, 2009.<br />
19<br />
Statistics Canada. http://www40.statcan.gc.ca/l01/cst01/demo52c-eng.htm. Accessed December 6, 2009.<br />
20<br />
Statistics Canada. www40.statcan.gc.ca/l01/cst01/demo40c-eng.htm. Accessed March 9, 2010. These are people who reported an Aboriginal<br />
identity. They are not included in the 1,008,855 visible minority population.<br />
21<br />
The type of population information varies for different diseases, based on data source.<br />
22<br />
Stepping Forward. Improving Addiction Care in British Columbia. B.C. Medical Association, 2009. http://www.bcma.org/files/Addiction_Stepping_Forward.pdf.<br />
p. 5. Accessed October 22, 2009.<br />
23<br />
Neurosciences <strong>Asset</strong> <strong>Map</strong> British Columbia. www.investbc.com/assetmaps.htm. Accessed October 15, 2009.<br />
24<br />
Stepping Out of the Shadows. Collaborating to Improve Services for Patients with Depression. https://www.bcma.org/files/Depression_paper_<br />
aug13.pdf. p. 12. Accessed October 22, 2009.<br />
25<br />
http://www.bccdc.ca/NR/rdonlyres/59BFCFBB-933D-4337-9305-E3E5FF30D272/0/EPI_Report_CDAnnual2008_20090806.pdf. Accessed November<br />
4, 2009.