

broschuere ee zahlen en bf
broschuere ee zahlen en bf
broschuere ee zahlen en bf

Create successful ePaper yourself
Turn your PDF publications into a flip-book with our unique Google optimized e-Paper software.
Heat supply<br />
20 R<strong>en</strong>ewable Energy Sources in Figures<br />
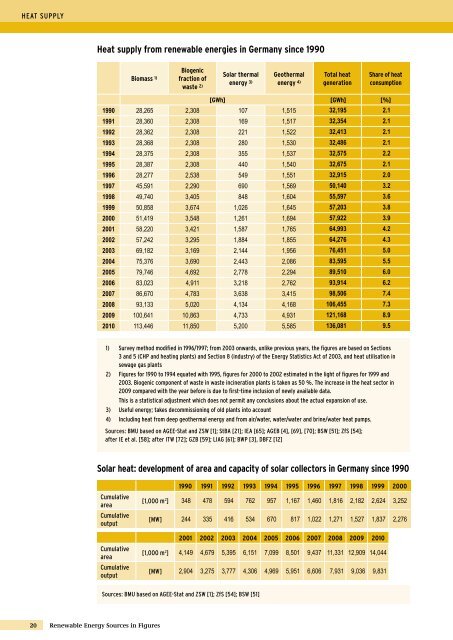
Heat supply from r<strong>en</strong>ewable <strong>en</strong>ergies in Germany since 1990<br />
Biomass 1)<br />
Biog<strong>en</strong>ic<br />
fraction of<br />
waste 2)<br />
Solar thermal<br />
<strong>en</strong>ergy 3)<br />
Geothermal<br />
<strong>en</strong>ergy 4)<br />
Total heat<br />
g<strong>en</strong>eration<br />
Share of heat<br />
consumption<br />
[GWh] [GWh] [%]<br />
1990 28,265 2,308 107 1,515 32,195 2.1<br />
1991 28,360 2,308 169 1,517 32,354 2.1<br />
1992 28,362 2,308 221 1,522 32,413 2.1<br />
1993 28,368 2,308 280 1,530 32,486 2.1<br />
1994 28,375 2,308 355 1,537 32,575 2.2<br />
1995 28,387 2,308 440 1,540 32,675 2.1<br />
1996 28,277 2,538 549 1,551 32,915 2.0<br />
1997 45,591 2,290 690 1,569 50,140 3.2<br />
1998 49,740 3,405 848 1,604 55,597 3.6<br />
1999 50,858 3,674 1,026 1,645 57,203 3.8<br />
2000 51,419 3,548 1,261 1,694 57,922 3.9<br />
2001 58,220 3,421 1,587 1,765 64,993 4.2<br />
2002 57,242 3,295 1,884 1,855 64,276 4.3<br />
2003 69,182 3,169 2,144 1,956 76,451 5.0<br />
2004 75,376 3,690 2,443 2,086 83,595 5.5<br />
2005 79,746 4,692 2,778 2,294 89,510 6.0<br />
2006 83,023 4,911 3,218 2,762 93,914 6.2<br />
2007 86,670 4,783 3,638 3,415 98,506 7.4<br />
2008 93,133 5,020 4,134 4,168 106,455 7.3<br />
2009 100,641 10,863 4,733 4,931 121,168 8.9<br />
2010 113,446 11,850 5,200 5,585 136,081 9.5<br />
1) survey method modified in 1996/1997; from 2003 onwards, unlike previous years, the figures are based on sections<br />
3 and 5 (cHp and heating plants) and section 8 (industry) of the <strong>en</strong>ergy statistics act of 2003, and heat utilisation in<br />
sewage gas plants<br />
2) Figures for 1990 to 1994 equated with 1995, figures for 2000 to 2002 estimated in the light of figures for 1999 and<br />
2003. Biog<strong>en</strong>ic compon<strong>en</strong>t of waste in waste incineration plants is tak<strong>en</strong> as 50 %. the increase in the heat sector in<br />
2009 compared with the year before is due to first-time inclusion of newly available data.<br />
this is a statistical adjustm<strong>en</strong>t which does not permit any conclusions about the actual expansion of use.<br />
3) useful <strong>en</strong>ergy; takes decommissioning of old plants into account<br />
4) Including heat from d<strong>ee</strong>p geothermal <strong>en</strong>ergy and from air/water, water/water and brine/water heat pumps.<br />
sources: BMu based on ag<strong>ee</strong>-stat and ZsW [1]; stBa [21]; Iea [65]; ageB [4], [69], [70]; BsW [51]; Zfs [54];<br />
after Ie et al. [58]; after ItW [72]; gZB [59]; lIag [61]; BWp [3], DBFZ [12]<br />
Solar heat: developm<strong>en</strong>t of area and capacity of solar collectors in Germany since 1990<br />
cumulative<br />
area<br />
cumulative<br />
output<br />
cumulative<br />
area<br />
cumulative<br />
output<br />
1990 1991 1992 1993 1994 1995 1996 1997 1998 1999 2000<br />
[1,000 m 2 ] 348 478 594 762 957 1,167 1,460 1,816 2,182 2,624 3,252<br />
[MW] 244 335 416 534 670 817 1,022 1,271 1,527 1,837 2,276<br />
2001 2002 2003 2004 2005 2006 2007 2008 2009 2010<br />
[1,000 m 2 ] 4,149 4,679 5,395 6,151 7,099 8,501 9,437 11,331 12,909 14,044<br />
[MW] 2,904 3,275 3,777 4,306 4,969 5,951 6,606 7,931 9,036 9,831<br />
sources: BMu based on ag<strong>ee</strong>-stat and ZsW [1]; Zfs [54]; BsW [51]


