

broschuere ee zahlen en bf
broschuere ee zahlen en bf
broschuere ee zahlen en bf

Create successful ePaper yourself
Turn your PDF publications into a flip-book with our unique Google optimized e-Paper software.
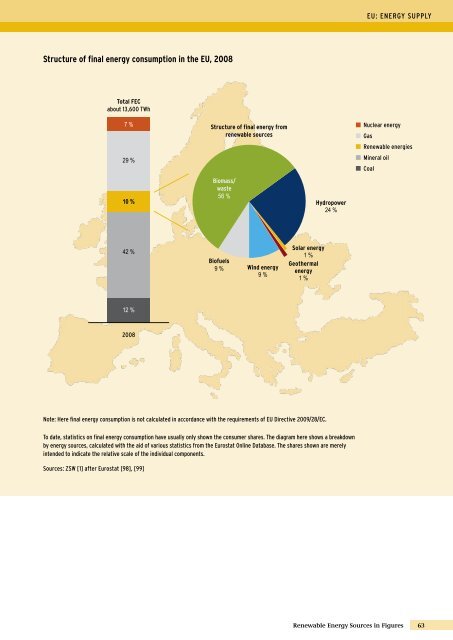
Structure of final <strong>en</strong>ergy consumption in the EU, 2008<br />
Total FEC<br />
about 13,600 twh<br />
7 %<br />
29 %<br />
10 %<br />
42 %<br />
12 %<br />
2008<br />
Structure of final <strong>en</strong>ergy from<br />
r<strong>en</strong>ewable sources<br />
biomass/<br />
waste<br />
56 %<br />
Biofuels<br />
9 %<br />
Wind <strong>en</strong>ergy<br />
9 %<br />
Solar <strong>en</strong>ergy<br />
1 %<br />
Geothermal<br />
<strong>en</strong>ergy<br />
1 %<br />
note: Here final <strong>en</strong>ergy consumption is not calculated in accordance with the requirem<strong>en</strong>ts of eU Directive 2009/28/ec.<br />
Hydropower<br />
24 %<br />
to date, statistics on final <strong>en</strong>ergy consumption have usually only shown the consumer shares. the diagram here shows a breakdown<br />
by <strong>en</strong>ergy sources, calculated with the aid of various statistics from the eurostat online Database. the shares shown are merely<br />
int<strong>en</strong>ded to indicate the relative scale of the individual compon<strong>en</strong>ts.<br />
Sources: ZSw [1] after eurostat [98], [99]<br />
eU: <strong>en</strong>ergy SUpply<br />
nuclear <strong>en</strong>ergy<br />
gas<br />
r<strong>en</strong>ewable <strong>en</strong>ergies<br />
Mineral oil<br />
coal<br />
R<strong>en</strong>ewable Energy Sources in Figures<br />
63


