broschuere ee zahlen en bf
broschuere ee zahlen en bf
broschuere ee zahlen en bf
You also want an ePaper? Increase the reach of your titles
YUMPU automatically turns print PDFs into web optimized ePapers that Google loves.
In 2008, the r<strong>en</strong>ewables share of electricity g<strong>en</strong>eration stood at 18.5 %, compared to 19.5 %<br />
in 1990. The relatively low growth of hydropower in the OECD is the main reason for the fall<br />
in the global share. With a share of 80 %, hydropower is the largest contributor to r<strong>en</strong>ewable<br />
electricity g<strong>en</strong>eration. However, hydropower pot<strong>en</strong>tial in most industrialised countries is<br />
already exhausted. In these countries the growth thrust n<strong>ee</strong>ded to increase the worldwide<br />
r<strong>en</strong>ewables share can only be achieved by stepping up the expansion of other r<strong>en</strong>ewable<br />
technologies.<br />
Looking at the non-OECD countries, in which more than half of global r<strong>en</strong>ewable electricity<br />
production takes place, there is reason to expect that in view of rising incomes and the faster<br />
population growth than in the industrialised countries, the growth in total electricity<br />
requirem<strong>en</strong>ts will in future be higher than in the OECD. As a result, the growth of r<strong>en</strong>ewables<br />
will at least have to k<strong>ee</strong>p pace with the global share.<br />
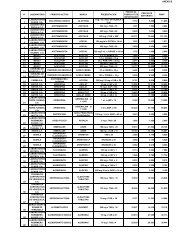
Electricity g<strong>en</strong>eration from r<strong>en</strong>ewable <strong>en</strong>ergies in various regions, 2008<br />
Hydropower<br />
Solid<br />
biomass 1)<br />
Other<br />
biomass<br />
Wind<br />
<strong>en</strong>ergy<br />
Geoth.<br />
<strong>en</strong>ergy<br />
WORLD: ELECTRICITY GENERATION<br />
Other<br />
Total<br />
r<strong>en</strong>ewablesbased<br />
electricity<br />
R<strong>en</strong>ewable Energy Sources in Figures<br />
Share of<br />
r<strong>en</strong>ewablesbased<br />
electricity<br />
[TWh] [%]<br />
Asia 2) 249 9 0 14 19 0 291 15.9<br />
Latin America 2) 673 30 0 1 3 0 707 66.2<br />
Africa 95 1 0 1 1 0 98 15.8<br />
EU-27 327 71 23 119 6 8 553 16.6<br />
Australia 12 1 1 4 0 0 18 7.1<br />
Canada 382 8 1 4 0 0 395 60.6<br />
China 585 2 0 13 0 0 601 17.2<br />
Japan 76 18 0 3 3 2 102 9.5<br />
Mexico 39 1 0 0 7 0 47 18.3<br />
Russia 165 0 0 0 0 0 165 15.9<br />
USA 257 51 9 56 17 2 392 9.0<br />
Non-OECD 1,895 42 0 31 24 0 1,992 21.0<br />
OECD 1,312 151 35 188 41 13 1,741 16.3<br />
World 3,208 194 35 219 65 13 3,733 18.5<br />
1) Including biog<strong>en</strong>ic fraction of municipal waste<br />
2) Asia excluding China and Japan; Latin America excluding Mexico<br />
Source: IEA [104]<br />
91


