Heat supply 20 R<strong>en</strong>ewable Energy Sources in Figures Heat supply from r<strong>en</strong>ewable <strong>en</strong>ergies in Germany since 1990 Biomass 1) Biog<strong>en</strong>ic fraction of waste 2) Solar thermal <strong>en</strong>ergy 3) Geothermal <strong>en</strong>ergy 4) Total heat g<strong>en</strong>eration Share of heat consumption [GWh] [GWh] [%] 1990 28,265 2,308 107 1,515 32,195 2.1 1991 28,360 2,308 169 1,517 32,354 2.1 1992 28,362 2,308 221 1,522 32,413 2.1 1993 28,368 2,308 280 1,530 32,486 2.1 1994 28,375 2,308 355 1,537 32,575 2.2 1995 28,387 2,308 440 1,540 32,675 2.1 1996 28,277 2,538 549 1,551 32,915 2.0 1997 45,591 2,290 690 1,569 50,140 3.2 1998 49,740 3,405 848 1,604 55,597 3.6 1999 50,858 3,674 1,026 1,645 57,203 3.8 2000 51,419 3,548 1,261 1,694 57,922 3.9 2001 58,220 3,421 1,587 1,765 64,993 4.2 2002 57,242 3,295 1,884 1,855 64,276 4.3 2003 69,182 3,169 2,144 1,956 76,451 5.0 2004 75,376 3,690 2,443 2,086 83,595 5.5 2005 79,746 4,692 2,778 2,294 89,510 6.0 2006 83,023 4,911 3,218 2,762 93,914 6.2 2007 86,670 4,783 3,638 3,415 98,506 7.4 2008 93,133 5,020 4,134 4,168 106,455 7.3 2009 100,641 10,863 4,733 4,931 121,168 8.9 2010 113,446 11,850 5,200 5,585 136,081 9.5 1) survey method modified in 1996/1997; from 2003 onwards, unlike previous years, the figures are based on sections 3 and 5 (cHp and heating plants) and section 8 (industry) of the <strong>en</strong>ergy statistics act of 2003, and heat utilisation in sewage gas plants 2) Figures for 1990 to 1994 equated with 1995, figures for 2000 to 2002 estimated in the light of figures for 1999 and 2003. Biog<strong>en</strong>ic compon<strong>en</strong>t of waste in waste incineration plants is tak<strong>en</strong> as 50 %. the increase in the heat sector in 2009 compared with the year before is due to first-time inclusion of newly available data. this is a statistical adjustm<strong>en</strong>t which does not permit any conclusions about the actual expansion of use. 3) useful <strong>en</strong>ergy; takes decommissioning of old plants into account 4) Including heat from d<strong>ee</strong>p geothermal <strong>en</strong>ergy and from air/water, water/water and brine/water heat pumps. sources: BMu based on ag<strong>ee</strong>-stat and ZsW [1]; stBa [21]; Iea [65]; ageB [4], [69], [70]; BsW [51]; Zfs [54]; after Ie et al. [58]; after ItW [72]; gZB [59]; lIag [61]; BWp [3], DBFZ [12] Solar heat: developm<strong>en</strong>t of area and capacity of solar collectors in Germany since 1990 cumulative area cumulative output cumulative area cumulative output 1990 1991 1992 1993 1994 1995 1996 1997 1998 1999 2000 [1,000 m 2 ] 348 478 594 762 957 1,167 1,460 1,816 2,182 2,624 3,252 [MW] 244 335 416 534 670 817 1,022 1,271 1,527 1,837 2,276 2001 2002 2003 2004 2005 2006 2007 2008 2009 2010 [1,000 m 2 ] 4,149 4,679 5,395 6,151 7,099 8,501 9,437 11,331 12,909 14,044 [MW] 2,904 3,275 3,777 4,306 4,969 5,951 6,606 7,931 9,036 9,831 sources: BMu based on ag<strong>ee</strong>-stat and ZsW [1]; Zfs [54]; BsW [51]
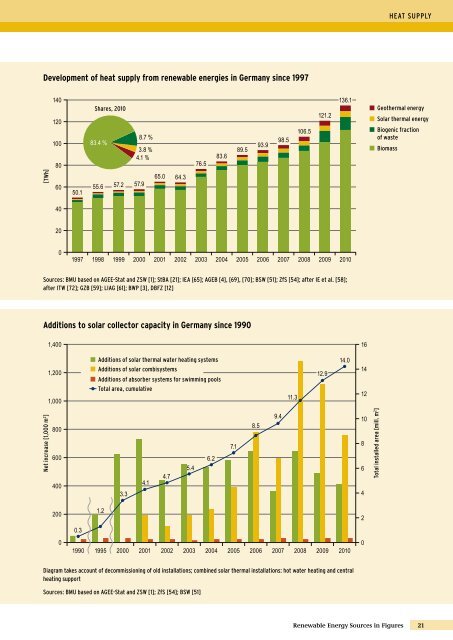
Developm<strong>en</strong>t of heat supply from r<strong>en</strong>ewable <strong>en</strong>ergies in Germany since 1997 [tWh] 140 120 100 80 60 40 20 0 50.1 shares, 2010 83.4 % 8.7 % 3.8 % 4.1 % 55.6 57.2 57.9 65.0 64.3 1997 1998 1999 2000 2001 2002 2003 2004 2005 2006 2007 2008 2009 2010 sources: BMu based on aG<strong>ee</strong>-stat and ZsW [1]; stBa [21]; Iea [65]; aGeB [4], [69], [70]; BsW [51]; Zfs [54]; after Ie et al. [58]; after ItW [72]; GZB [59]; lIaG [61]; BWp [3], DBFZ [12] 76.5 83.6 89.5 Additions to solar collector capacity in Germany since 1990 Net increase [1,000 m 2 ] 1,400 1,200 1,000 800 600 400 200 0 0.3 additions of solar thermal water heating systems additions of solar combisystems additions of absorber systems for swimming pools total area, cumulative 1.2 3.3 4.1 4.7 5.4 1990 1995 2000 2001 2002 2003 2004 2005 2006 2007 2008 2009 2010 Diagram takes account of decommissioning of old installations; combined solar thermal installations: hot water heating and c<strong>en</strong>tral heating support sources: BMu based on aG<strong>ee</strong>-stat and ZsW [1]; Zfs [54]; BsW [51] 6.2 7.1 8.5 93.9 9.4 98.5 11.3 106.5 121.2 12.9 136.1 14.0 16 14 12 10 R<strong>en</strong>ewable Energy Sources in Figures 8 6 4 2 0 total installed area [mill. m 2 ] Heat supply Geothermal <strong>en</strong>ergy solar thermal <strong>en</strong>ergy Biog<strong>en</strong>ic fraction of waste Biomass 21