broschuere ee zahlen en bf
broschuere ee zahlen en bf
broschuere ee zahlen en bf
You also want an ePaper? Increase the reach of your titles
YUMPU automatically turns print PDFs into web optimized ePapers that Google loves.
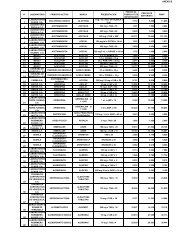
pot<strong>en</strong>tIal capacItIes<br />
Long-term sustainable use pot<strong>en</strong>tial of r<strong>en</strong>ewable <strong>en</strong>ergies for electricity,<br />
heat and fuel production in Germany<br />
Use<br />
2010<br />
Pot<strong>en</strong>tial capacity Remarks<br />
Yield Output<br />
Electricity g<strong>en</strong>eration [TWh] [TWh/a] [MW]<br />
hydropower 1) 20.6 25 5,200 running water and natural inflow to reservoirs<br />
Wind <strong>en</strong>ergy 2) 37.8<br />
on land 37.6 175 70,000<br />
power calculated on the basis of the average<br />
value of 2,500 h/a<br />
at sea (offshore) 0.2 280 70,000<br />
power calculated on the basis of the average<br />
value of 4,000 h/a<br />
Biomass 3) 33.3 60 10,000 some g<strong>en</strong>eration as chp g<strong>en</strong>eration<br />
photovoltaics 11.7 150 165,000 4) only suitable rooftop, facade and<br />
municipal areas<br />
Geothermal <strong>en</strong>ergy 0.03 90 15,000<br />
range of 66 – 290 tWh, dep<strong>en</strong>ding on requirem<strong>en</strong>ts<br />
pertaining to heat use (chp g<strong>en</strong>eration)<br />
Total 103.5 780<br />
Share with respect to gross electricity consumption in 2010 17.0 % 128.3 %<br />
Heat g<strong>en</strong>eration [TWh] [TWh/a]<br />
Biomass 125.3 170 Including useful heat from chp g<strong>en</strong>eration<br />
Geothermal <strong>en</strong>ergy 5.6 300<br />
only <strong>en</strong>ergy production from hydrothermal<br />
sources<br />
solar thermal <strong>en</strong>ergy 5.2 400 only suitable rooftop and municipal areas<br />
Total 136.1 870<br />
Share with respect to final <strong>en</strong>ergy consumption<br />
for heat in 2010 5) 9.5 % 61.1 %<br />
Fuels [TWh] [TWh/a]<br />
Biomass 35.7 90<br />
Total 35.7 90<br />
Share with respect to fuel consumption in 2010 5.8 % 14.5 %<br />
Share with respect to total final<br />
<strong>en</strong>ergy consumption in 2010<br />
the figures do not include r<strong>en</strong>ewables-based <strong>en</strong>ergy imports.<br />
1) excluding marine <strong>en</strong>ergy<br />
2) provisional figures (ongoing expert review)<br />
3) Including biog<strong>en</strong>ic waste<br />
sources: nitsch [24]; scholz [25]; ZsW [1]; consortium: WI, dlr, IFeU [76]<br />
10.9 % 69.1 %<br />
2.35 million ha cultivation area for <strong>en</strong>ergy crops<br />
(of a total of 4.2 million ha cultivation area)<br />
the perc<strong>en</strong>tage share of r<strong>en</strong>ewable <strong>en</strong>ergy use<br />
pot<strong>en</strong>tial increases due to improvem<strong>en</strong>ts in <strong>en</strong>ergy<br />
effici<strong>en</strong>cy and <strong>en</strong>ergy savings, making a<br />
100 % supply of r<strong>en</strong>ewable <strong>en</strong>ergies possible in<br />
the long term.<br />
4) capacity based on module output (mWp ); the corresponding alternating<br />
curr<strong>en</strong>t capacity is around 150 GW<br />
5) space heating, hot water and other process heat<br />
Estimates of pot<strong>en</strong>tial may show very considerable variations as a result of differ<strong>en</strong>t assumptions<br />
about the availability of suitable sites, the technical properties of the used technologies<br />
and other factors.<br />
The guide values shown here take account of nature and landscape conservation issues in<br />
particular, and therefore repres<strong>en</strong>t a lower limit for the technically exploitable pot<strong>en</strong>tial.<br />
Use of biomass for <strong>en</strong>ergy purposes displays great flexibility. Dep<strong>en</strong>ding on requirem<strong>en</strong>ts, the<br />
allocation of pot<strong>en</strong>tial to the heat, power and motor fuel sectors may vary. This applies in particular<br />
to the production of <strong>en</strong>ergy crops (determined here on the basis of 4.2 million hectares).<br />
R<strong>en</strong>ewable Energy Sources in Figures<br />
53


