

broschuere ee zahlen en bf
broschuere ee zahlen en bf
broschuere ee zahlen en bf

Create successful ePaper yourself
Turn your PDF publications into a flip-book with our unique Google optimized e-Paper software.
ANNEx: METhODOLOGICAL NOTES<br />
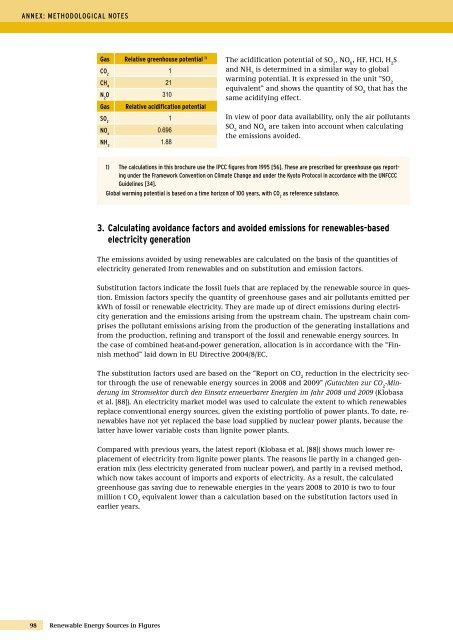
Gas Relative gr<strong>ee</strong>nhouse pot<strong>en</strong>tial 1)<br />
CO 2<br />
Ch 4<br />
98 R<strong>en</strong>ewable Energy Sources in Figures<br />
1<br />
21<br />
N 2 O 310<br />
Gas Relative acidification pot<strong>en</strong>tial<br />
SO 2<br />
NO x<br />
Nh 3<br />
1<br />
0.696<br />
1.88<br />
The acidification pot<strong>en</strong>tial of SO 2 , NO X , HF, HCl, H 2 S<br />
and NH 3 is determined in a similar way to global<br />
warming pot<strong>en</strong>tial. It is expressed in the unit “SO 2<br />
equival<strong>en</strong>t” and shows the quantity of SO 2 that has the<br />
same acidifying effect.<br />
In view of poor data availability, only the air pollutants<br />
SO 2 and NO X are tak<strong>en</strong> into account wh<strong>en</strong> calculating<br />
the emissions avoided.<br />
1) The calculations in this brochure use the IPCC figures from 1995 [56]. These are prescribed for gr<strong>ee</strong>nhouse gas reporting<br />
under the Framework Conv<strong>en</strong>tion on Climate Change and under the Kyoto Protocol in accordance with the UNFCCC<br />
Guidelines [34].<br />
Global warming pot<strong>en</strong>tial is based on a time horizon of 100 years, with CO as refer<strong>en</strong>ce substance.<br />
2<br />
3. Calculating avoidance factors and avoided emissions for r<strong>en</strong>ewablesbased<br />
electricity g<strong>en</strong>eration<br />
The emissions avoided by using r<strong>en</strong>ewables are calculated on the basis of the quantities of<br />
electricity g<strong>en</strong>erated from r<strong>en</strong>ewables and on substitution and emission factors.<br />
Substitution factors indicate the fossil fuels that are replaced by the r<strong>en</strong>ewable source in question.<br />
Emission factors specify the quantity of gr<strong>ee</strong>nhouse gases and air pollutants emitted per<br />
kWh of fossil or r<strong>en</strong>ewable electricity. They are made up of direct emissions during electricity<br />
g<strong>en</strong>eration and the emissions arising from the upstream chain. The upstream chain comprises<br />
the pollutant emissions arising from the production of the g<strong>en</strong>erating installations and<br />
from the production, refining and transport of the fossil and r<strong>en</strong>ewable <strong>en</strong>ergy sources. In<br />
the case of combined heat-and-power g<strong>en</strong>eration, allocation is in accordance with the “Finnish<br />
method” laid down in EU Directive 2004/8/EC.<br />
The substitution factors used are based on the “Report on CO 2 reduction in the electricity sector<br />
through the use of r<strong>en</strong>ewable <strong>en</strong>ergy sources in 2008 and 2009” (Gutacht<strong>en</strong> zur CO 2 -Minderung<br />
im Stromsektor durch d<strong>en</strong> Einsatz erneuerbarer Energi<strong>en</strong> im Jahr 2008 und 2009 (Klobasa<br />
et al. [88]). An electricity market model was used to calculate the ext<strong>en</strong>t to which r<strong>en</strong>ewables<br />
replace conv<strong>en</strong>tional <strong>en</strong>ergy sources, giv<strong>en</strong> the existing portfolio of power plants. To date, r<strong>en</strong>ewables<br />
have not yet replaced the base load supplied by nuclear power plants, because the<br />
latter have lower variable costs than lignite power plants.<br />
Compared with previous years, the latest report (Klobasa et al. [88]) shows much lower replacem<strong>en</strong>t<br />
of electricity from lignite power plants. The reasons lie partly in a changed g<strong>en</strong>eration<br />
mix (less electricity g<strong>en</strong>erated from nuclear power), and partly in a revised method,<br />
which now takes account of imports and exports of electricity. As a result, the calculated<br />
gr<strong>ee</strong>nhouse gas saving due to r<strong>en</strong>ewable <strong>en</strong>ergies in the years 2008 to 2010 is two to four<br />
million t CO 2 equival<strong>en</strong>t lower than a calculation based on the substitution factors used in<br />
earlier years.


