iaea human health series publications - SEDIM
iaea human health series publications - SEDIM
iaea human health series publications - SEDIM
- No tags were found...

Create successful ePaper yourself
Turn your PDF publications into a flip-book with our unique Google optimized e-Paper software.
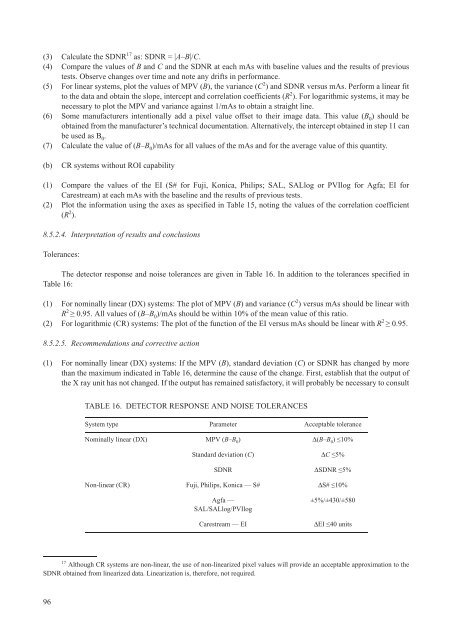
(3) Calculate the SDNR 17 as: SDNR = |A–B|/C.(4) Compare the values of B and C and the SDNR at each mAs with baseline values and the results of previoustests. Observe changes over time and note any drifts in performance.(5) For linear systems, plot the values of MPV (B), the variance (C 2 ) and SDNR versus mAs. Perform a linear fitto the data and obtain the slope, intercept and correlation coefficients (R 2 ). For logarithmic systems, it may benecessary to plot the MPV and variance against 1/mAs to obtain a straight line.(6) Some manufacturers intentionally add a pixel value offset to their image data. This value (B 0 ) should beobtained from the manufacturer’s technical documentation. Alternatively, the intercept obtained in step 11 canbe used as B 0 .(7) Calculate the value of (B–B 0 )/mAs for all values of the mAs and for the average value of this quantity.(b)CR systems without ROI capability(1) Compare the values of the EI (S# for Fuji, Konica, Philips; SAL, SALlog or PVIlog for Agfa; EI forCarestream) at each mAs with the baseline and the results of previous tests.(2) Plot the information using the axes as specified in Table 15, noting the values of the correlation coefficient(R 2 ).8.5.2.4. Interpretation of results and conclusionsTolerances:The detector response and noise tolerances are given in Table 16. In addition to the tolerances specified inTable 16:(1) For nominally linear (DX) systems: The plot of MPV (B) and variance (C 2 ) versus mAs should be linear withR 2 ≥ 0.95. All values of (B–B 0 )/mAs should be within 10% of the mean value of this ratio.(2) For logarithmic (CR) systems: The plot of the function of the EI versus mAs should be linear with R 2 ≥ 0.95.8.5.2.5. Recommendations and corrective action(1) For nominally linear (DX) systems: If the MPV (B), standard deviation (C) or SDNR has changed by morethan the maximum indicated in Table 16, determine the cause of the change. First, establish that the output ofthe X ray unit has not changed. If the output has remained satisfactory, it will probably be necessary to consultTABLE 16. DETECTOR RESPONSE AND NOISE TOLERANCESSystem type Parameter Acceptable toleranceNominally linear (DX) MPV (B–B 0 ) Δ(B–B 0 ) ≤10%Standard deviation (C) ΔC ≤5%SDNR ΔSDNR ≤5%Non-linear (CR) Fuji, Philips, Konica — S# ΔS# ≤10%Agfa —SAL/SALlog/PVIlogCarestream — EI±5%/±430/±580ΔEI ≤40 units17Although CR systems are non-linear, the use of non-linearized pixel values will provide an acceptable approximation to theSDNR obtained from linearized data. Linearization is, therefore, not required.96