iaea human health series publications - SEDIM
iaea human health series publications - SEDIM
iaea human health series publications - SEDIM
- No tags were found...

Create successful ePaper yourself
Turn your PDF publications into a flip-book with our unique Google optimized e-Paper software.
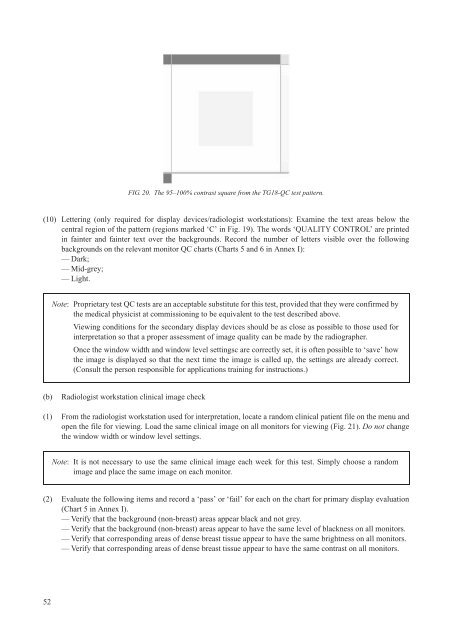
FIG. 20. The 95–100% contrast square from the TG18-QC test pattern.(10) Lettering (only required for display devices/radiologist workstations): Examine the text areas below thecentral region of the pattern (regions marked ‘C’ in Fig. 19). The words ‘QUALITY CONTROL’ are printedin fainter and fainter text over the backgrounds. Record the number of letters visible over the followingbackgrounds on the relevant monitor QC charts (Charts 5 and 6 in Annex I):—Dark;—Mid-grey;—Light.Note: Proprietary test QC tests are an acceptable substitute for this test, provided that they were confirmed bythe medical physicist at commissioning to be equivalent to the test described above.Viewing conditions for the secondary display devices should be as close as possible to those used forinterpretation so that a proper assessment of image quality can be made by the radiographer.Once the window width and window level settingsc are correctly set, it is often possible to ‘save’ howthe image is displayed so that the next time the image is called up, the settings are already correct.(Consult the person responsible for applications training for instructions.)(b)Radiologist workstation clinical image check(1) From the radiologist workstation used for interpretation, locate a random clinical patient file on the menu andopen the file for viewing. Load the same clinical image on all monitors for viewing (Fig. 21). Do not changethe window width or window level settings.Note: It is not necessary to use the same clinical image each week for this test. Simply choose a randomimage and place the same image on each monitor.(2) Evaluate the following items and record a ‘pass’ or ‘fail’ for each on the chart for primary display evaluation(Chart 5 in Annex I).— Verify that the background (non-breast) areas appear black and not grey.— Verify that the background (non-breast) areas appear to have the same level of blackness on all monitors.— Verify that corresponding areas of dense breast tissue appear to have the same brightness on all monitors.— Verify that corresponding areas of dense breast tissue appear to have the same contrast on all monitors.52