- Page 1 and 2:
X raysdel matrixCs scintillatorLine
- Page 3 and 4:
QUALITY ASSURANCE PROGRAMMEFOR DIGI
- Page 5 and 6:
IAEA HUMAN HEALTH SERIES No. 17QUAL
- Page 7 and 8:
FOREWORDThe application of radiatio
- Page 14:
An effective QA programme is necess
- Page 17 and 18:
The Integrating the Healthcare Ente
- Page 21 and 22:
technology. Systems containing othe
- Page 23 and 24:
X raysTop electrodea-Se layerCharge
- Page 25 and 26:
dose received by inhomogeneous real
- Page 27 and 28:
2.3.8.1. Soft copy displayFlat pane
- Page 29 and 30:
3. ELEMENTS OF HIGH QUALITY MAMMOGR
- Page 31:
— The ability to mask edges of ma
- Page 34 and 35: Disposal orsaleNew facility(start h
- Page 36 and 37: 4.2.3. Radiographer (mammography te
- Page 38 and 39: 5.2.2. Electronic versus geometric
- Page 40 and 41: To allow full utilization of the di
- Page 42 and 43: 5.7. ARTEFACTSWhile the incidence o
- Page 44 and 45: FIG. 10. Detector crystallization.
- Page 46 and 47: FIG. 13. A more subtle example of a
- Page 48 and 49: FIG. 16. An example of poor collima
- Page 51 and 52: 7. RADIOGRAPHER’S QUALITY CONTROL
- Page 53 and 54: 7.1. DAILY TESTS7.1.1. Monitor insp
- Page 55 and 56: 7.1.3. Daily flat field phantom ima
- Page 57 and 58: 7.1.4. Visual inspection for artefa
- Page 59 and 60: 7.1.5. Laser printer sensitometry7.
- Page 61 and 62: 7.1.6. Image plate erasure (CR syst
- Page 63 and 64: FIG. 19. Modified TG18-QC pattern w
- Page 65 and 66: FIG. 21. Radiologist workstation wi
- Page 67 and 68: 7.2.1.6. Time frame for corrective
- Page 69 and 70: 7.2.3. Weekly quality control test
- Page 71 and 72: Note: It is not necessary to view t
- Page 73 and 74: TABLE 7. TOLERANCES FOR IMAGING WEE
- Page 75 and 76: 7.2.4.4. Interpretation of results
- Page 77 and 78: 7.3.1.5. Recommendations and correc
- Page 79 and 80: artefacts are typically best seen w
- Page 81 and 82: 7.3.3.5. Recommendations and correc
- Page 83: 7.4.1.3. Methodology(1) Annotate th
- Page 87 and 88: (3) Including examinations of at le
- Page 89 and 90: 7.5. SEMI-ANNUAL TESTS7.5.1. Comput
- Page 91 and 92: 8. MEDICAL PHYSICIST’S QUALITY CO
- Page 93 and 94: 8.1. NOTE ON IMAGE NAMING CONVENTIO
- Page 95 and 96: (16) On any randomly selected patie
- Page 97 and 98: FIG. 30. Positioning of bathroom sc
- Page 99 and 100: (6) The target, filter, kV, grid, d
- Page 101 and 102: (2) Stack the 20 and 25 mm PMMA sla
- Page 103 and 104: TABLE 13. ACCEPTABLE AND ACHIEVABLE
- Page 105 and 106: 8.5. DETECTOR PERFORMANCE8.5.1. Bas
- Page 107 and 108: 8.5.2. Detector response and noise8
- Page 109 and 110: the service engineer responsible fo
- Page 111 and 112: (13) Using the annotation tool on t
- Page 113 and 114: Breast supportPMMA slabBreast suppo
- Page 115 and 116: (10) Place the thinner test object
- Page 117 and 118: 8.6. EVALUATION OF SYSTEM RESOLUTIO
- Page 119 and 120: TABLE 17. ACCEPTABLE FREQUENCIES AT
- Page 121 and 122: 8.7. X RAY EQUIPMENT CHARACTERISTIC
- Page 123 and 124: 8.7.2. Incident air kerma at the en
- Page 125 and 126: 8.8. DOSIMETRY8.8.1. Mean glandular
- Page 127 and 128: TABLE 21. ACCEPTABLE AND ACHIEVABLE
- Page 129 and 130: FIG. 34. Suggested layout for ruler
- Page 131 and 132: 8.10. IMAGE DISPLAY QUALITYThe accu
- Page 133 and 134: FIG. 35. Modified TG18-QC test patt
- Page 135 and 136:
8.10.1.5. Interpretation of results
- Page 137 and 138:
8.10.2. Monitor luminance response
- Page 139 and 140:
TABLE 22. MONITOR PERFORMANCE TOLER
- Page 141 and 142:
FIG. 38. Measurement of illuminatio
- Page 143 and 144:
8.11. LASER PRINTER8.11.1. Laser pr
- Page 145 and 146:
8.11.1.5. Recommendations and corre
- Page 147:
8.12.1.4. Interpretation of results
- Page 150 and 151:
iopsies are performed, a sink is of
- Page 152 and 153:
Appendix IISPECIFICATIONS OF TEST E
- Page 154 and 155:
TABLE 24. SPECIFICATIONS OF TEST EQ
- Page 156 and 157:
FIG. 40. Image acquired with a unif
- Page 158 and 159:
FIG. 43. The left hand image is par
- Page 160 and 161:
FIG. 45. A TG18-QC test pattern dis
- Page 162 and 163:
[29] ALSAGER, A., YOUNG, K.C., ODUK
- Page 165 and 166:
Annex IRADIOGRAPHER DATA COLLECTION
- Page 167 and 168:
Chart 2 — DIGITAL MAMMOGRAPHY (DM
- Page 169 and 170:
Chart 4 LASER PRINTER SENSITOMETRY
- Page 171 and 172:
Chart 6 — WEEKLY DISPLAY MONITOR
- Page 173 and 174:
Chart 7(b) WEEKLY QC TEST OBJECT:
- Page 175 and 176:
Chart 9 — SAFETY AND FUNCTION CHE
- Page 177 and 178:
Chart 11 — LASER PRINTER ARTEFACT
- Page 179 and 180:
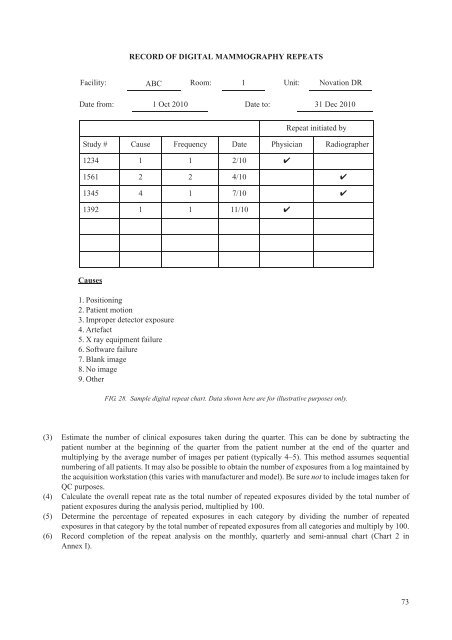
Chart 13(a) — RECORD OF DIGITAL M
- Page 181 and 182:
Chart 14 — CR PLATE SENSITIVITY M
- Page 183 and 184:
Annex IIITHE MAMMOGRAPHY EXTRACTThe
- Page 185 and 186:
GLOSSARYair kerma. The energy depos
- Page 187 and 188:
image quality. The overall merit of
- Page 189:
CONTRIBUTORS TO DRAFTING AND REVIEW